Incident Details page
Clicking on an incident![]() A collection of one or more related triggers. Relationships that cause triggers to be combined into incidents include application, location, operating system, or a trigger by itself. on the Incidents page shows that incident's details in a separate page that summarizes the network resources affected by the incident, including the incident's primary indicator and any correlated indicators, as well as analysis resulting from the runbook
A collection of one or more related triggers. Relationships that cause triggers to be combined into incidents include application, location, operating system, or a trigger by itself. on the Incidents page shows that incident's details in a separate page that summarizes the network resources affected by the incident, including the incident's primary indicator and any correlated indicators, as well as analysis resulting from the runbook![]() An automated workflow that executes a series of steps or tasks in response to a triggered event, such as the detection of anomalous behavior generating an incident, a lifecycle event, or a manually executed runbook. associated with the incident type.
An automated workflow that executes a series of steps or tasks in response to a triggered event, such as the detection of anomalous behavior generating an incident, a lifecycle event, or a manually executed runbook. associated with the incident type.
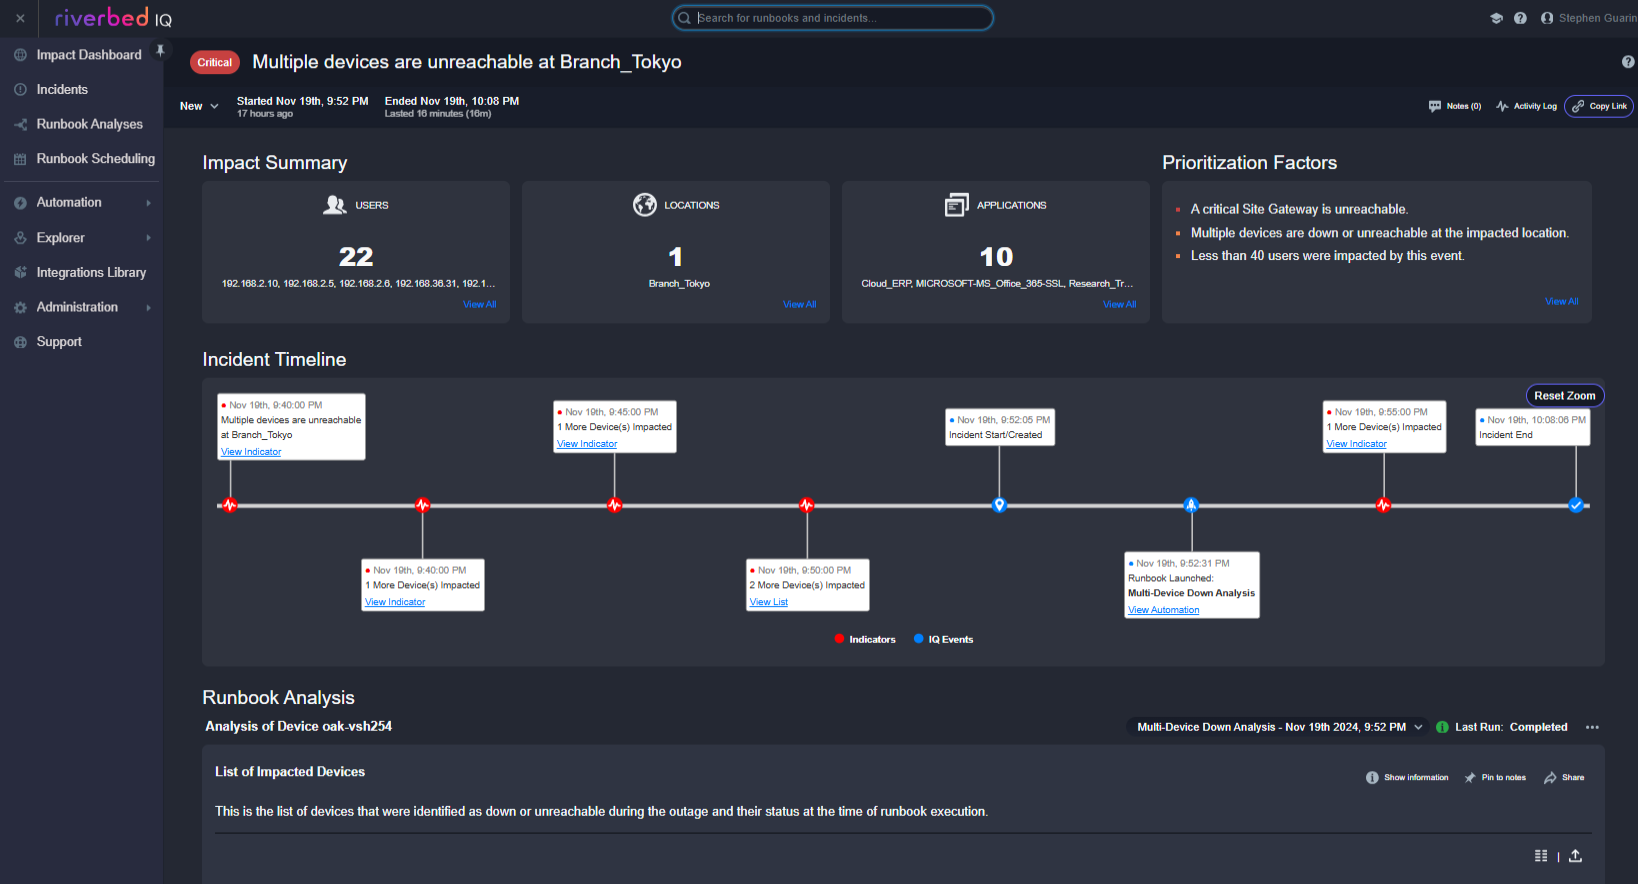
The Incident Details page shows the following for the incident:
-
Priority: Priority
 A classification that indicates the importance or urgency of an incident, used to prioritize investigation and remediation efforts. is assigned to the incident based on the results of the associated runbook analysis. The priority may change over the life of the incident if subsequent executions of the runbook produce different results.
 -
Incident Type (e.g., Device Down, Interface Congestion): The incident type is determined by Riverbed IQ Ops's analysis of the incident's corresponding detections
One or more indicators that are correlated and may act as a trigger for incident creation or runbook execution.. -
Status pulldown: This pulldown shows the incident's current status
The current state of an incident or runbook, indicating its progress through investigation and resolution workflows.. Click to change. Valid choices are New, Investigating, and Closed. -
Notes: The Notes section allows you to annotate the incident with useful text to keep with it. Notes can be added directly using the UI
User Interface. The visual components and controls that users interact with to access features and manage the system., or you can add notes to an incident using a lifecycle runbook that runs when an incident lifecycle event occurs. -
Activity Log: The Activity Log summarizes each action executed upon the incident. Examples of actions that are displayed in the activity log are: incident created, incident note added, lifecycle note added, and incident status changed.
-
Share: Copy this incident page's link to send it to another user.
-
Date information: The Date information section shows when the incident started and when it ended. If the incident is ongoing then it says ongoing.
-
Impact Summary: The Impact Summary shows the number of Users, Locations
An entity type representing physical or logical locations in the customer environment where entities are deployed and monitored., and Applications An entity type representing software applications deployed in the customer environment that are monitored for performance and anomalies. known to be affected by the incident, as well as Prioritization Factors, which summarize why Riverbed IQ Ops assigns the incident the priority that it does. -
Prioritization Factors: The Prioritization Factors section shows the output
A document containing data sets generated by the execution of a runbook, including output of queries and reports from point products, as well as output of analysis or other runbook nodes. from all executed Set Incident Priority nodes Individual components that make up a runbook automation, each performing a specific function such as data queries, transformations, logic, integrations, or visualizations. that were executed. The Set Incident Priority node allows you to enter a priority value and text that should be displayed if the node is executed. -
Incident Sources: The Incident Sources section shows the incident's primary indicator and any correlated indicators. For incidents that involve application activity at a location (including those opened from Activity Response Time analytics), charts and metric
A measurement or data point that is monitored and analyzed to detect anomalies and generate incidents. labels in Incident Sources, the Incident Timeline, and Runbook Analysis Output use the same indicator context and naming so the values you see stay aligned across those areas. -
Incident Timeline: The Incident Timeline shows the incident events, lifecycle events, and the indicators that contributed to the incident. See the incident timeline topic for more information.
-
Runbook Analysis Output: The Runbook Analysis Output section shows the results of the most recent execution of the incident's associated runbook.
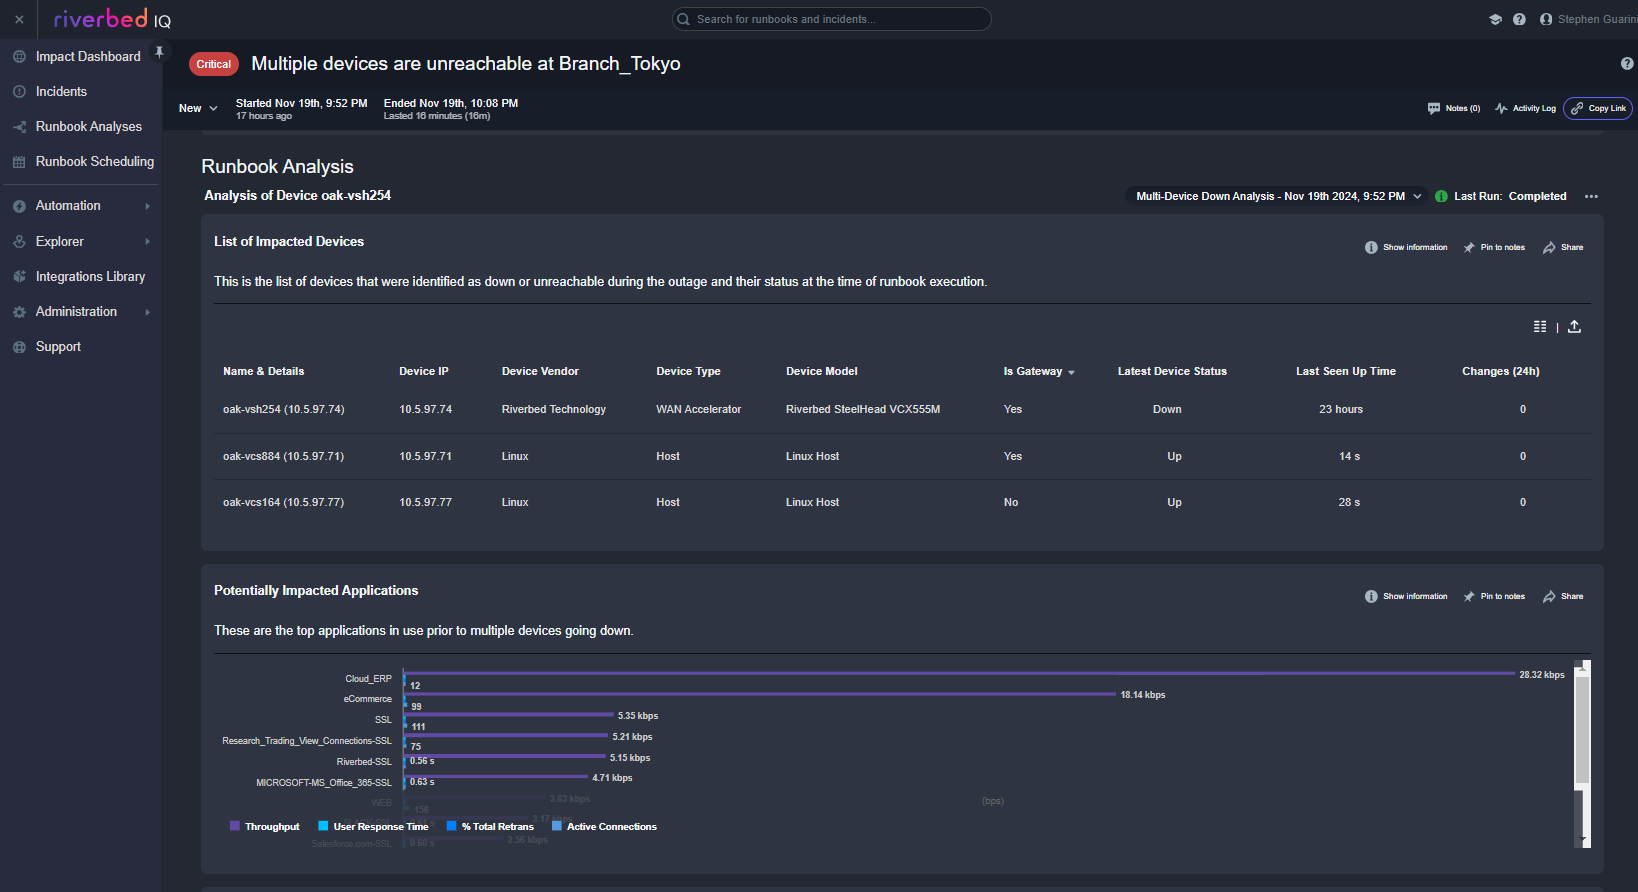
The data in a table or chart that is displayed in the Runbook Analysis section of the incident details page can be exported to CSV or PNG. The tables only support CSV while the charts support both CSV and PNG. To export the data in a table, click on the export button to the right of the column chooser button as shown here:

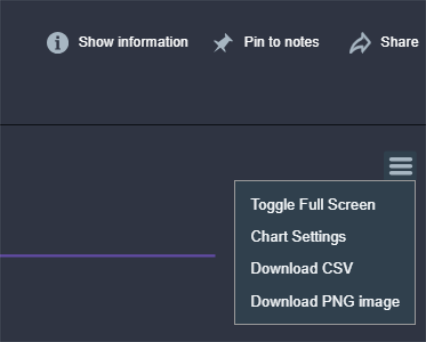
To export the data in a chart click on the Hamburger icon in the chart toolbar and then select either Download CSV or Download PNG image as shown below: