Incident Generation and Runbook Execution
Incident generation is how Riverbed IQ Ops turns observed behavior in your environment into actionable incidents![]() A collection of one or more related triggers. Relationships that cause triggers to be combined into incidents include application, location, operating system, or a trigger by itself.. The platform continuously models key measurements
A collection of one or more related triggers. Relationships that cause triggers to be combined into incidents include application, location, operating system, or a trigger by itself.. The platform continuously models key measurements![]() A measurement or data point that is monitored and analyzed to detect anomalies and generate incidents. from your data sources
A measurement or data point that is monitored and analyzed to detect anomalies and generate incidents. from your data sources![]() A product in your network that forwards data to the system. This data can be streaming data used to detect anomalies and generate incidents, or data that can be fetched on demand when runbooks are executed., flags anomalies
A product in your network that forwards data to the system. This data can be streaming data used to detect anomalies and generate incidents, or data that can be fetched on demand when runbooks are executed., flags anomalies![]() An unexpected event or measurement that does not match the expected model. as indicators
An unexpected event or measurement that does not match the expected model. as indicators![]() An observed change in a specific metric stream that is recognized as being outside of an expected model. Indicators are correlated into triggers, and one or more triggers are grouped into incidents., correlates those indicators into detections
An observed change in a specific metric stream that is recognized as being outside of an expected model. Indicators are correlated into triggers, and one or more triggers are grouped into incidents., correlates those indicators into detections![]() One or more indicators that are correlated and may act as a trigger for incident creation or runbook execution., and creates an incident for each detection. Each new incident automatically triggers a Runbook
One or more indicators that are correlated and may act as a trigger for incident creation or runbook execution., and creates an incident for each detection. Each new incident automatically triggers a Runbook![]() An automated workflow that executes a series of steps or tasks in response to a triggered event, such as the detection of anomalous behavior generating an incident, a lifecycle event, or a manually executed runbook. run, so you get both a clear record of what happened and runbook output (impact, prioritization, and analysis) in one place.
An automated workflow that executes a series of steps or tasks in response to a triggered event, such as the detection of anomalous behavior generating an incident, a lifecycle event, or a manually executed runbook. run, so you get both a clear record of what happened and runbook output (impact, prioritization, and analysis) in one place.
That flow reduces noise, speeds triage, and gives you a single place to see what went wrong and what the system has already inferred. You view and manage incidents from the Incidents page. From there you can filter the list, open an incident to see its details and runbook analysis, and change status or add notes.
This topic expands on the pipeline introduced in Connecting a Customer Environment to Riverbed IQ Ops SaaS:
-
Ingest & Analytics models key measurements
 A measurement or data point that is monitored and analyzed to detect anomalies and generate incidents..
 -
Anomalous
An unexpected event or measurement that does not match the expected model. measurements generate associated indicators An observed change in a specific metric stream that is recognized as being outside of an expected model. Indicators are correlated into triggers, and one or more triggers are grouped into incidents.. -
Correlation groups assemble indicators into detections
One or more indicators that are correlated and may act as a trigger for incident creation or runbook execution. that form the basis of incidents A collection of one or more related triggers. Relationships that cause triggers to be combined into incidents include application, location, operating system, or a trigger by itself.. -
Incidents trigger
A set of one or more indicators that have been correlated based on certain relationships, such as time, metric type, application affected, location, or network device. Runbook An automated workflow that executes a series of steps or tasks in response to a triggered event, such as the detection of anomalous behavior generating an incident, a lifecycle event, or a manually executed runbook. executions.
This diagram illustrates how information flows and is processed to become an incident and trigger a runbook.
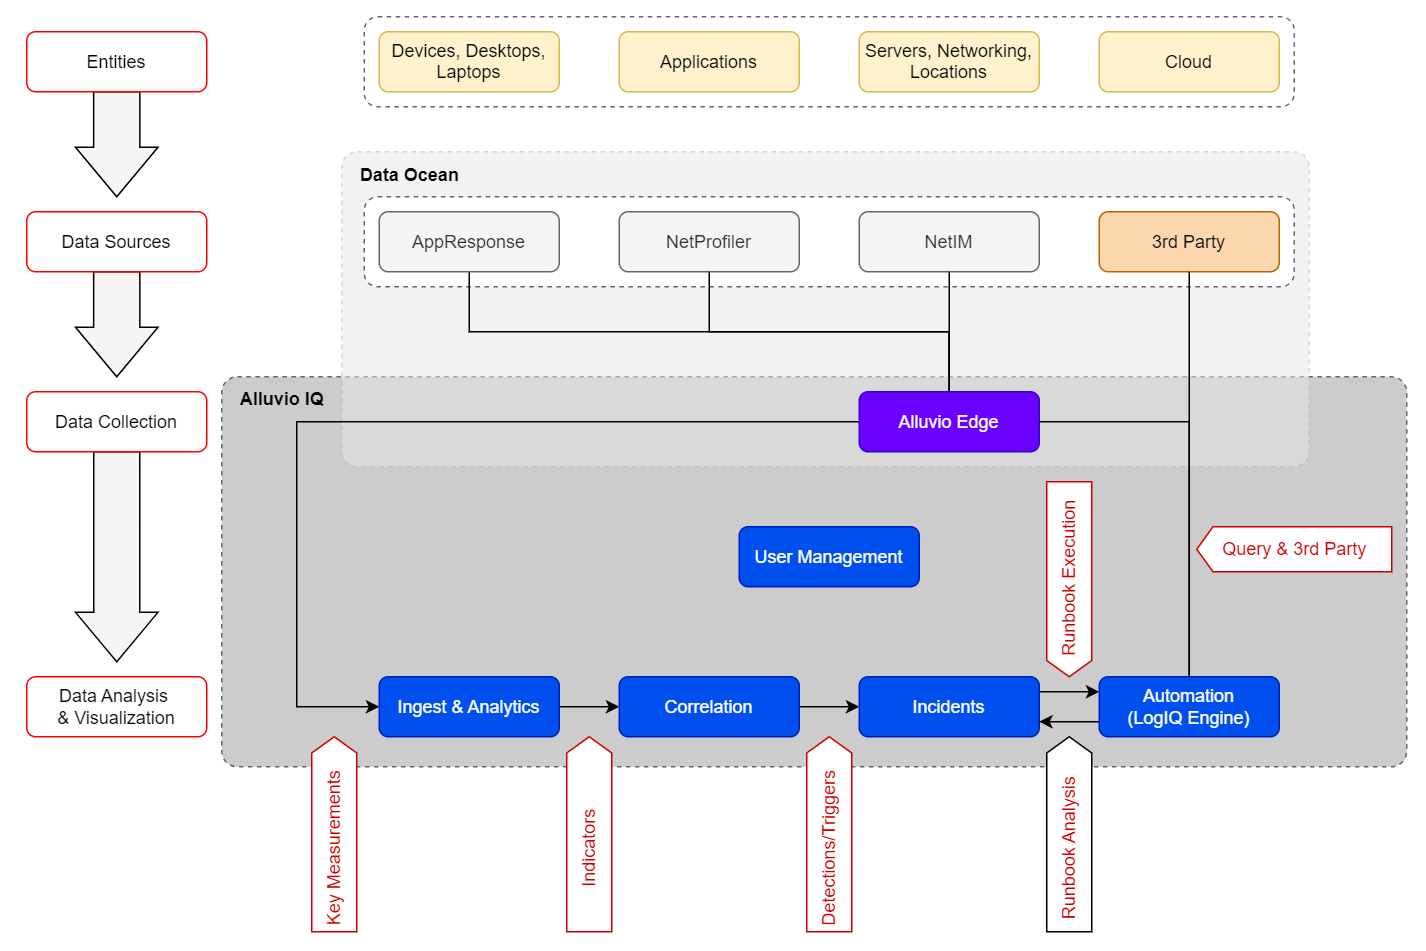
Incident Generation and Runbook Execution
Data sources: key measurements
The key measurements flowing into a customer’s Riverbed IQ Ops tenant depend directly on the data sources present in the customer environment and connected to that Riverbed IQ Ops tenant.
Each data source type streams the following key measurements:
Pipeline Inputs: Key Measurements
|
Data Source |
Entity |
Metric |
|---|---|---|
|
Riverbed NetProfiler |
Application / Client Location |
User Response Time (see Table Note-1 below) |
|
MoS |
||
|
Interface |
In Utilization |
|
|
Out Utilization |
||
|
Riverbed AppResponse |
Application / Client Location |
User Response Time |
|
Throughput (see Table Note-2 below) |
||
|
% Retrans Packets |
||
|
% Failed Connections |
||
|
Riverbed NetIM |
Device |
Device Status |
|
Device Uptime |
||
|
Interface |
Interface Status |
|
|
In Packet Error Rate |
||
|
Out Packet Error Rate |
||
|
In Packet Drops Rate |
||
|
Out Packet Drops Rate |
||
|
In Utilization |
||
|
Out Utilization |
||
| Aternity | Application / Client Location | Activity Network Time |
| Activity Response Time | ||
| Page Load Network Time | ||
| % Hang Time | ||
|
Table Notes: |
||
|
1 - [Metric: User Response Time] is: > An approximation of Riverbed AppResponse [user-response-time] because Riverbed NetProfiler does not currently account for [connection_setup_time], while Riverbed AppResponse does. > User Response Time is only processed for named applications (e.g., excludes: ICMP, SNMP, TCP_Unknown, and UDP_Unknown). 2 - [Metric: Throughput] The platform monitors this metric only for VoIP-related applications: {VOIP, SIP, RTP}. |
||
Ingest & Analytics: indicators
Ingest & Analytics models key measurements and classifies significant variance as anomalies, generating an indicator![]() An observed change in a specific metric stream that is recognized as being outside of an expected model. Indicators are correlated into triggers, and one or more triggers are grouped into incidents. for each. The platform supports several anomaly detection algorithms (e.g., Static Threshold, Time-series Baseline, Dynamic Threshold).
An observed change in a specific metric stream that is recognized as being outside of an expected model. Indicators are correlated into triggers, and one or more triggers are grouped into incidents. for each. The platform supports several anomaly detection algorithms (e.g., Static Threshold, Time-series Baseline, Dynamic Threshold).
See Ingest & Analytics: Indicators for an overview and descriptions of each algorithm.
Current key measurements and associated anomaly detection algorithms
For each key measurement, Ingest & Analytics is preconfigured with specific anomaly detection algorithms. A quick-reference table maintains the mapping of data sources, entities, and metrics to those algorithms.
See Current Key Measurements and Associated Anomaly Detection Algorithms for the full reference table and notes.
Correlation: detections
Correlation processes every indicator from Ingest & Analytics to find associations and group related indicators into a single detection![]() One or more indicators that are correlated and may act as a trigger for incident creation or runbook execution.. Correlation designates one indicator as the Primary (the leading indicator of a problem) and it drives incident creation and Runbook selection. The rest are Correlated indicators.
One or more indicators that are correlated and may act as a trigger for incident creation or runbook execution.. Correlation designates one indicator as the Primary (the leading indicator of a problem) and it drives incident creation and Runbook selection. The rest are Correlated indicators.
See Correlation: Detections for details.
Incidents
Riverbed Console surfaces anomalous events (detections) as incident![]() A collection of one or more related triggers. Relationships that cause triggers to be combined into incidents include application, location, operating system, or a trigger by itself. reports. The platform creates a new incident for new events and automatically executes an associated runbook. The platform matches recurring events to an existing active incident and they do not trigger another Runbook run.
A collection of one or more related triggers. Relationships that cause triggers to be combined into incidents include application, location, operating system, or a trigger by itself. reports. The platform creates a new incident for new events and automatically executes an associated runbook. The platform matches recurring events to an existing active incident and they do not trigger another Runbook run.
See Incidents for incident anatomy, lifecycle, and how Runbook output appears in the report.
Automation (LogIQ Engine)
The LogIQ engine runs automated investigations (Runbooks) tied to an event (detection/trigger) and attaches the resulting analysis to the incident (e.g., business impact, supporting data). System-level incident triggers and any user-defined custom triggers determine which runbook runs.
See Automation (LogIQ Engine) for system-level triggers, custom triggers, and how Runbooks are selected.