Connecting a Customer Environment to Riverbed IQ Ops SaaS
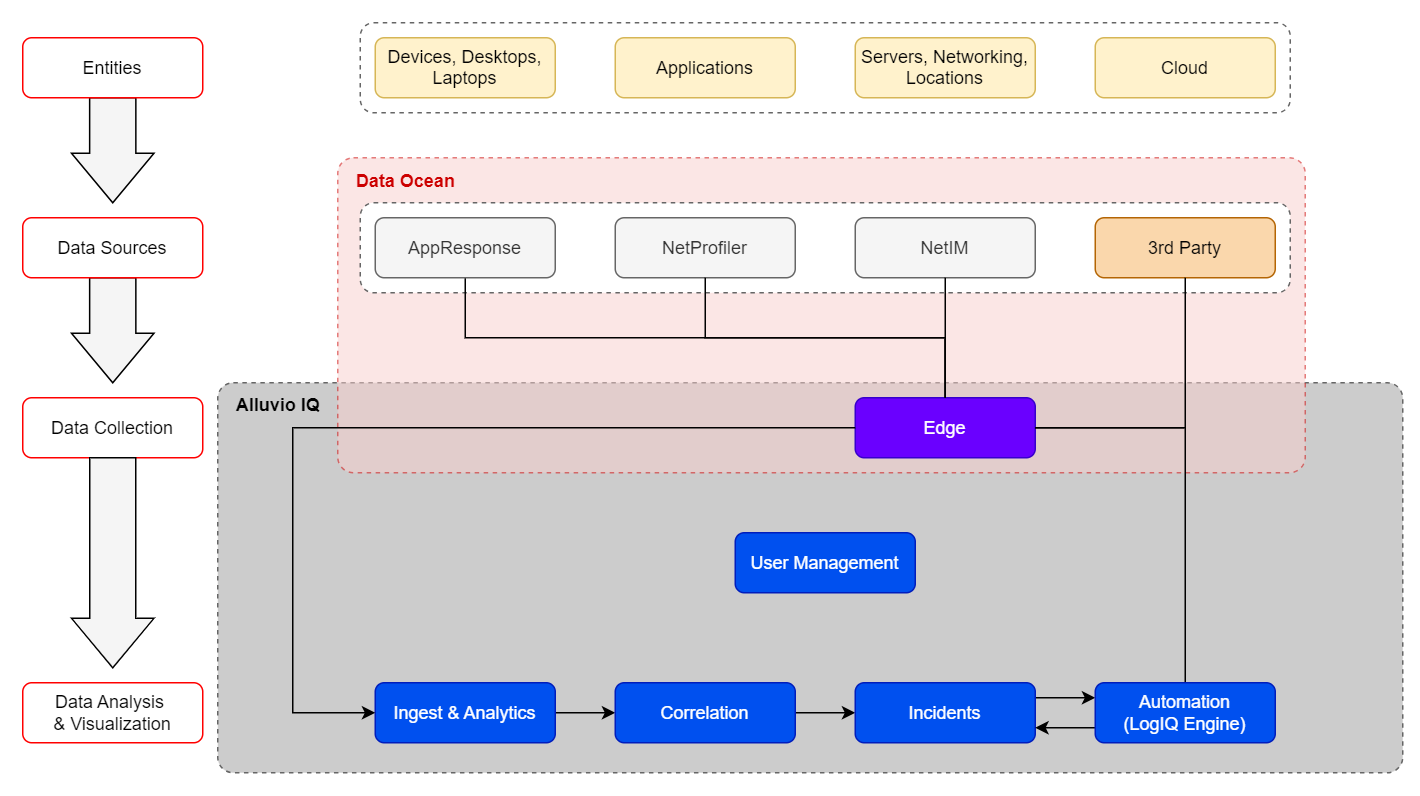
This illustration shows how data sources![]() A product in your network that forwards data to the system. This data can be streaming data used to detect anomalies and generate incidents, or data that can be fetched on demand when runbooks are executed. residing in the customer environment connect to Riverbed IQ Ops:
A product in your network that forwards data to the system. This data can be streaming data used to detect anomalies and generate incidents, or data that can be fetched on demand when runbooks are executed. residing in the customer environment connect to Riverbed IQ Ops:
Note these prerequisites:
-
The target data sources
 A product in your network that forwards data to the system. This data can be streaming data used to detect anomalies and generate incidents, or data that can be fetched on demand when runbooks are executed. must be configured with credentials that permit Riverbed IQ Ops to connect and establish the two-way conversation that is needed for the data source to stream key measurements A measurement or data point that is monitored and analyzed to detect anomalies and generate incidents. to Riverbed IQ Ops, and for the data source to process/reply to Runbook An automated workflow that executes a series of steps or tasks in response to a triggered event, such as the detection of anomalous behavior generating an incident, a lifecycle event, or a manually executed runbook. requests that occur over the course of an automated investigation.
 -
The target Riverbed Edge platform needs to be selected and prepared (currently, Riverbed IQ Ops supports deploying Riverbed Edge on the following: AWS, Azure, and VMware ESXi).
-
Riverbed IQ Ops employs a Shared Responsibility Model for Riverbed Edge in which Riverbed supplies Riverbed Edge functionality on top of a Customer-supplied and managed VM.
-
Configure the Riverbed Edge gateway on your Riverbed IQ Ops tenant (see Configuring Riverbed Edge and Data Sourcess).
-
You must prepare a Customer-owned/managed VM environment upon which Riverbed Edge can be configured. (Currently, Riverbed IQ Ops supports deploying Riverbed Edge in a number of VM environments).
-
Then, use the Riverbed-supplied cloud-init or ISO file (depending on the VM Type) to configure Riverbed Edge functionality in the target VM-environment (see Configuring Riverbed Edge and Data Sources).
-
-
Once the Riverbed Edge gateway is configured, configure the target data sources on your Riverbed IQ Ops tenant (see Configuring Riverbed Edge and Data Sources).
Once all Riverbed Edge(s) and data source(s) are configured on the Riverbed IQ Ops tenant, data will begin to flow into the system and:
-
The Data Ocean begins to take shape:
-
This is a distributed repository of customer environment information that is accessible to Riverbed IQ Ops. It comprises a small amount of core information that is cached in the customer’s Riverbed IQ Ops tenant and the vast full fidelity data that resides in the native Riverbed data sources (e.g., while executing an automation, the Runbook may quickly retrieve cached information from the customer’s Riverbed IQ Ops tenant, or may issue a query directly to a data source to tap into high fidelity data).
-
-
Key Measurements begin to flow into the pipeline:
-
Ingest & Analytics: begins processing key measurements
-
Certain key measurements
A measurement or data point that is monitored and analyzed to detect anomalies and generate incidents. have a simple model (e.g. static threshold) that enable anomalies An unexpected event or measurement that does not match the expected model. to be immediately detected One or more indicators that are correlated and may act as a trigger for incident creation or runbook execution./processed all the way through incident A collection of one or more related triggers. Relationships that cause triggers to be combined into incidents include application, location, operating system, or a trigger by itself.-generation and Runbook An automated workflow that executes a series of steps or tasks in response to a triggered event, such as the detection of anomalous behavior generating an incident, a lifecycle event, or a manually executed runbook. execution. -
Other key measurements employ a more complex model (e.g time-series baseline) that require time to build. As a result, it takes time to detect anomalous behavior for these key measurements (and further process those anomalies into Incidents with associate Runbook-executions), e.g.,
-
It takes 2-days to build an initial daily-seasonal time-series baseline model, and 14-days to build an initial weekly-seasonal time-series baseline model.
-
Alert: While these models are building, the detection of anomalies and generation of associated Incidents will vary.
-
There will be no associated Indicators
An observed change in a specific metric stream that is recognized as being outside of an expected model. Indicators are correlated into triggers, and one or more triggers are grouped into incidents./Incidents for the first 2-days (while the initial daily-seasonal model is building). -
After the initial daily-seasonal model is built (2-days after observing a new Key Measurement):
-
Anomalies
An unexpected event or measurement that does not match the expected model. to the daily-seasonal model are detected One or more indicators that are correlated and may act as a trigger for incident creation or runbook execution. and associated Incidents are generated. -
Simultaneously over the next 12-days: the system builds the 14-day/weekly-seasonal model.
-
-
After the initial weekly-seasonal model is built (14-days after observing a new Key Measurement):
-
Anomalies
An unexpected event or measurement that does not match the expected model. to the weekly-seasonal model are detected One or more indicators that are correlated and may act as a trigger for incident creation or runbook execution. and associated Incidents are generated. -
The system now continuously learns from the customer environment and evolves the weekly-seasonal model as the behaviors/patterns in the customer environment changes.
-
-
-
-
-