Impact Dashboard
The Impcat Dashboard shows which resources in your network are affected most by current incidents![]() A collection of one or more related triggers. Relationships that cause triggers to be combined into incidents include application, location, operating system, or a trigger by itself.. Click any object in any view to see the corresponding incident's details on the Incidents page.
A collection of one or more related triggers. Relationships that cause triggers to be combined into incidents include application, location, operating system, or a trigger by itself.. Click any object in any view to see the corresponding incident's details on the Incidents page.
The Impact Dashboard appears by default when you launch Riverbed IQ Ops, and can be displayed at any time by clicking Impact Dashboard in the Navigation menu at the left side of the Riverbed IQ Ops window.
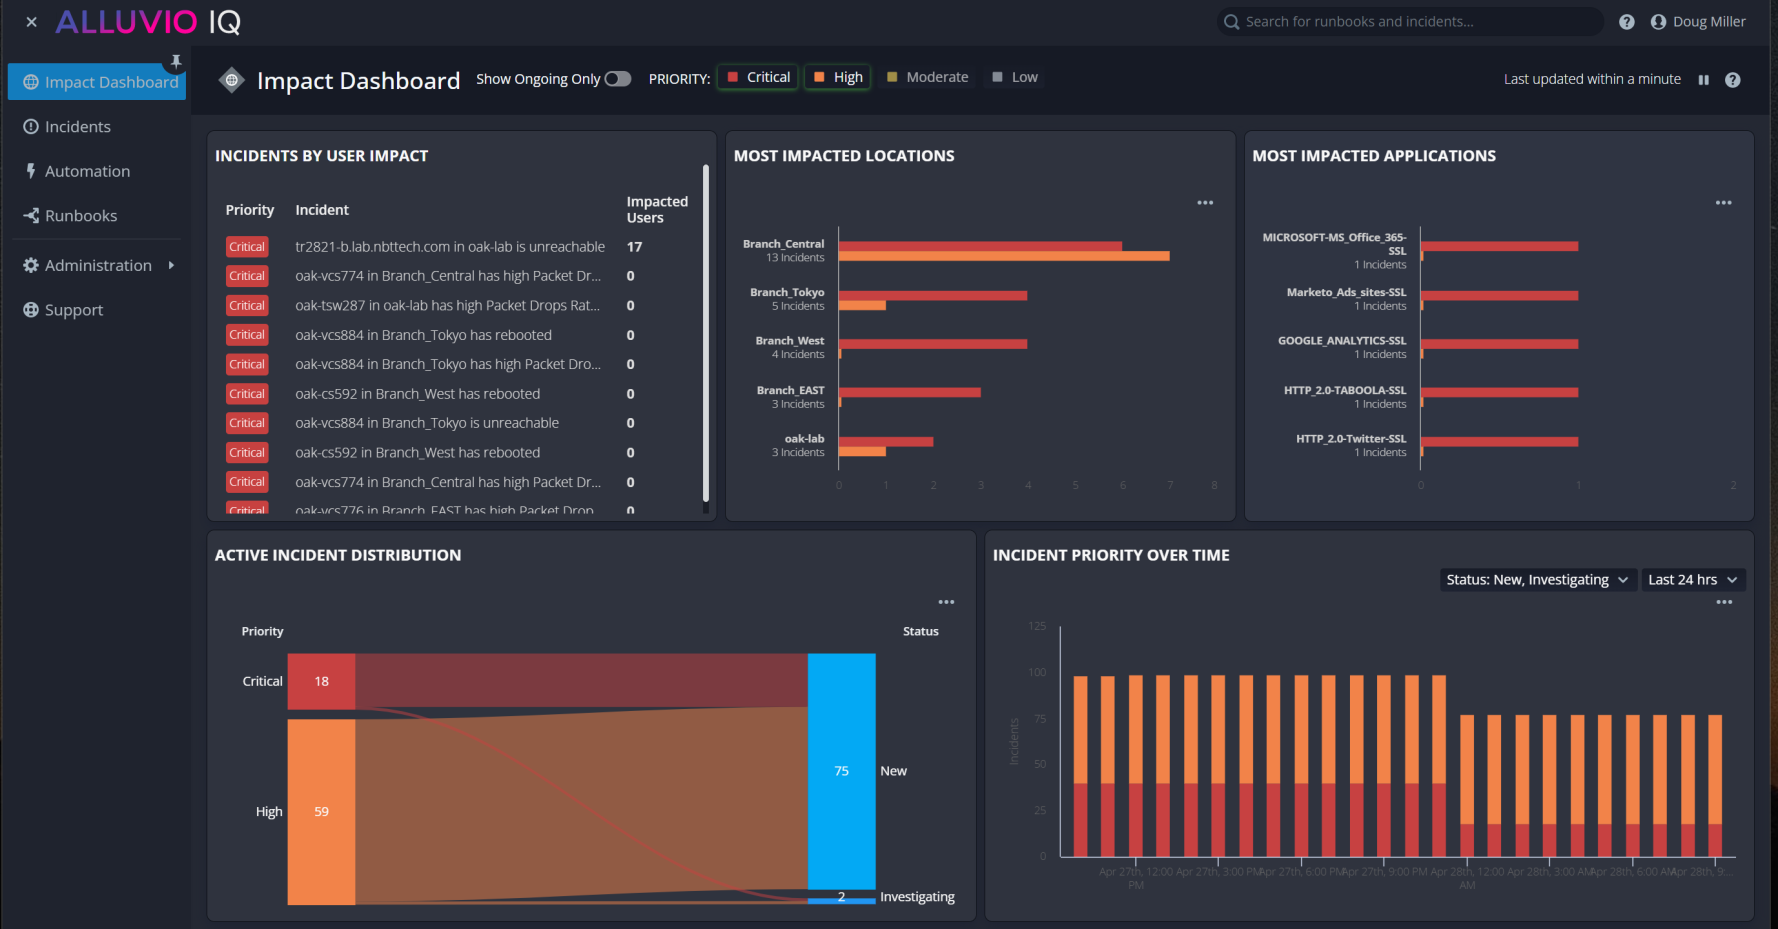
The Impact Dashboard provides these views of your network resources:
-
Incidents By User Impact: The current incidents affecting the largest numbers of individual users.
-
Most Impacted Locations: The recognized locations
 An entity type representing physical or logical locations in the customer environment where entities are deployed and monitored. affected by the largest number of current incidents.
 -
Most Impacted Applications: The specific applications
An entity type representing software applications deployed in the customer environment that are monitored for performance and anomalies. affected by the largest number of current incidents. -
Active Incident Distribution: Current incidents summarized by priority
A classification that indicates the importance or urgency of an incident, used to prioritize investigation and remediation efforts. and status The current state of an incident or runbook, indicating its progress through investigation and resolution workflows.. -
Incident Priority Over Time: Current incidents shown over a recent time interval, indicating when incidents have occurred, according to the priorities displayed.
The data displayed in the views can be filtered by Priority, using the selectable options at the top of the page. The data is updated frequently (every minute, by default), but you can pause the updates if you want to, using the Pause/Start control at the top of the page.