Incident Timeline
The incident![]() A collection of one or more related triggers. Relationships that cause triggers to be combined into incidents include application, location, operating system, or a trigger by itself. timeline shows the occurrence of the following events in time for a specified incident:
A collection of one or more related triggers. Relationships that cause triggers to be combined into incidents include application, location, operating system, or a trigger by itself. timeline shows the occurrence of the following events in time for a specified incident:
-
IQ Ops events: The incident events, such as incident started, runbook
 An automated workflow that executes a series of steps or tasks in response to a triggered event, such as the detection of anomalous behavior generating an incident, a lifecycle event, or a manually executed runbook. launched, and incident end.
 -
Lifecycle events: The lifecycle events, such as indicators
An observed change in a specific metric stream that is recognized as being outside of an expected model. Indicators are correlated into triggers, and one or more triggers are grouped into incidents. added, note added, and indicators updated. -
Indicators: The primary indicator and any correlated indicators associated with this incident.
The image below shows the incident timeline view.
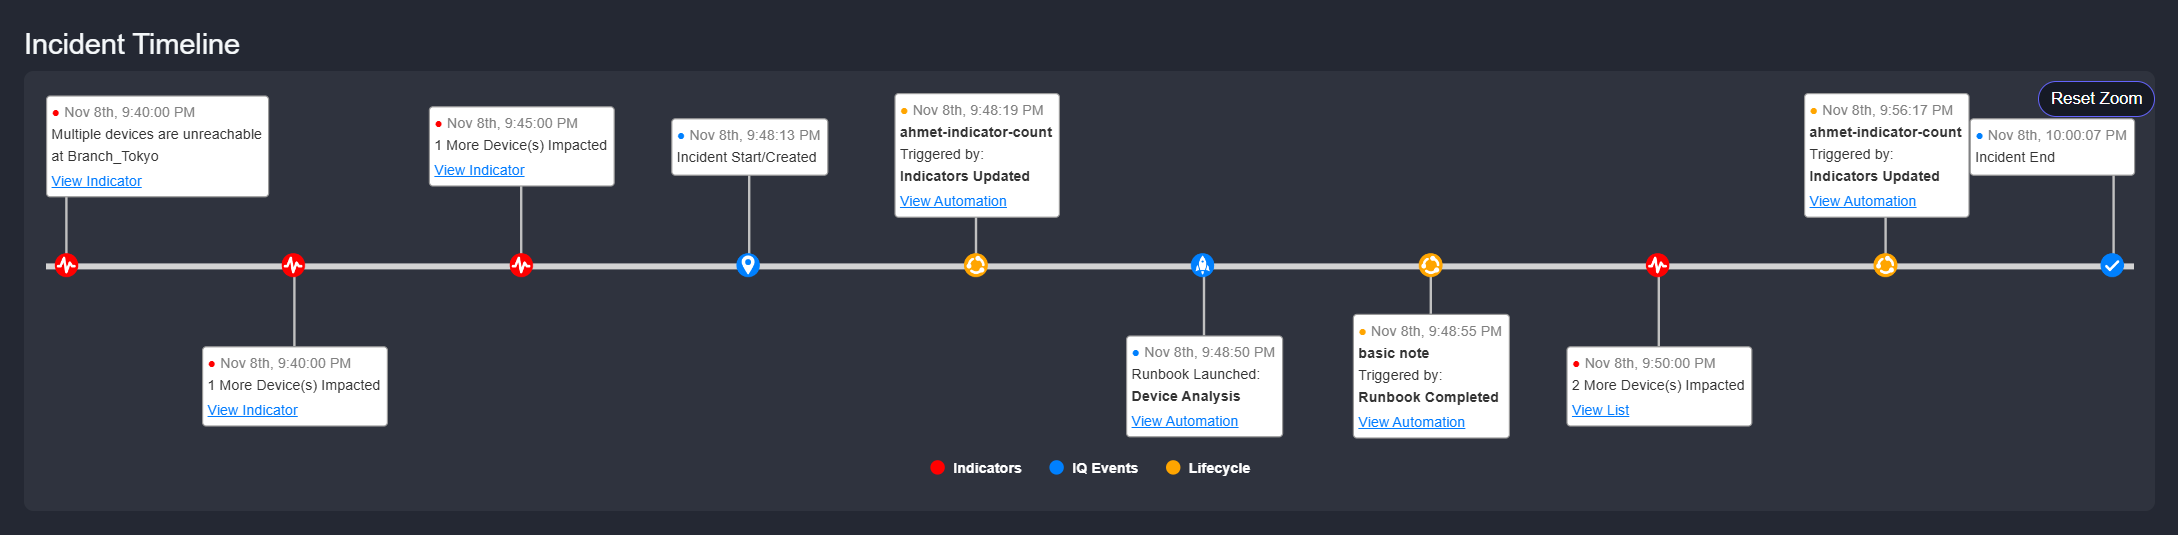
Each item on the timeline has an associated label. Most, but not all, labels contain a link which opens a dialog with additional information when clicked. Here is a description of the links that are provided:
-
View Indicator: Displays the chart with the data for the earliest indicator.
-
View List: Displays the table of correlated indicators.
-
View Automation: Displays the Debug Runbook Flow view for the previously run incident or lifecycle runbook.
The timeline shows the events in the order they occurred. But the event spacing is not based on the true time elapsed between successive events, they are equally spaced based on the width of the screen. To zoom in on a portion of the timeline, click the mouse where you want to start the zoom and drag to where you want to end the zoom and release the mouse. To reset the zoom back to its original state, click Reset Zoom. Clicking on individual legend items allows you to filter the timeline, for example to only show event types selected in the legend.