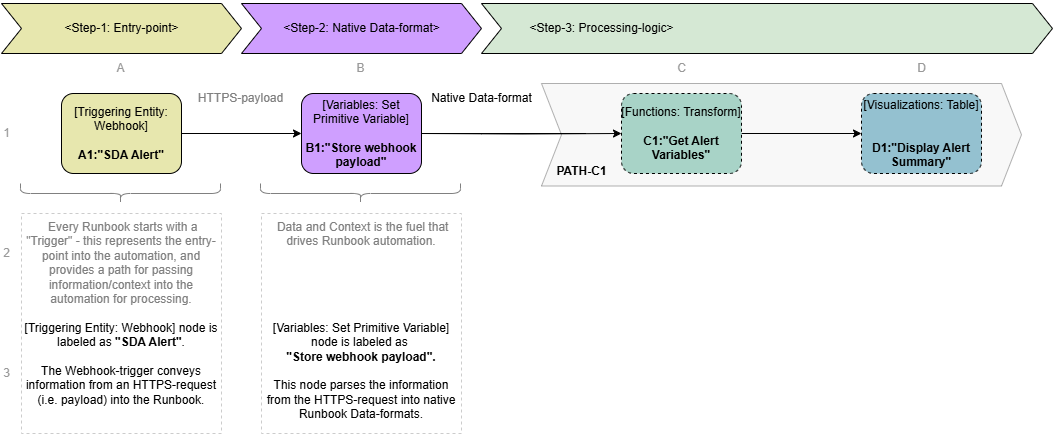
Path-C1: Display Summary Alert Information
This logic![]() A runbook node category that adds conditions to branch the runbook, enabling conditional execution paths based on data and context. path processes the information passed in by the external/third-party entity
A runbook node category that adds conditions to branch the runbook, enabling conditional execution paths based on data and context. path processes the information passed in by the external/third-party entity![]() Things deployed in the customer environment that are needed to run the business, such as applications, devices, interfaces, and locations. (via HTTP-Request Body) to:
Things deployed in the customer environment that are needed to run the business, such as applications, devices, interfaces, and locations. (via HTTP-Request Body) to:
C1: Get Current Alert Variables employs Functions: Transform node![]() Individual components that make up a runbook automation, each performing a specific function such as data queries, transformations, logic, integrations, or visualizations. to convert Runbook
Individual components that make up a runbook automation, each performing a specific function such as data queries, transformations, logic, integrations, or visualizations. to convert Runbook![]() An automated workflow that executes a series of steps or tasks in response to a triggered event, such as the detection of anomalous behavior generating an incident, a lifecycle event, or a manually executed runbook. runtime-variables into output
An automated workflow that executes a series of steps or tasks in response to a triggered event, such as the detection of anomalous behavior generating an incident, a lifecycle event, or a manually executed runbook. runtime-variables into output![]() A document containing data sets generated by the execution of a runbook, including output of queries and reports from point products, as well as output of analysis or other runbook nodes. properties of this node. These output properties get passed to subtending nodes.
A document containing data sets generated by the execution of a runbook, including output of queries and reports from point products, as well as output of analysis or other runbook nodes. properties of this node. These output properties get passed to subtending nodes.
C2: Display Alert employs Visualizations: Table node to display some of the supplied information in a table.
C1: Functions: Transform - Get Current Alert Variables
The Functions: Transform node formats the data needed by the Runbook automation![]() Automated procedures that are executed as the result of a trigger. Automations consist of a single entry point and a sequence of connected nodes that define the processing logic. into JSON, enabling the runbook to provide native input to another node. The transformation is performed according to the Transform Template defined in the Functions: Transform node.
Automated procedures that are executed as the result of a trigger. Automations consist of a single entry point and a sequence of connected nodes that define the processing logic. into JSON, enabling the runbook to provide native input to another node. The transformation is performed according to the Transform Template defined in the Functions: Transform node.
Placement of the Functions: Transform node on the Canvas in the Runbook Editor
There are two methods to place the Functions: Transform node in the canvas of the Runbook Editor.
-
Find Functions: Transform in the palette on the left-side of the Runbook Editor and drag it onto the canvas to the right of the Variables: Set Primitive Variable node:
-
The Variables: Set Primitive Variable node is a precursor for the Functions: Transform node. Connect the data flow from Triggering Entity: Webhook to Functions: Transform
-
-
Alternatively, click on the plus sign on the Variables: Set Primitive Variable node to reveal a pop-up menu of relevant nodes. Then, find and select the Functions: Transform node.
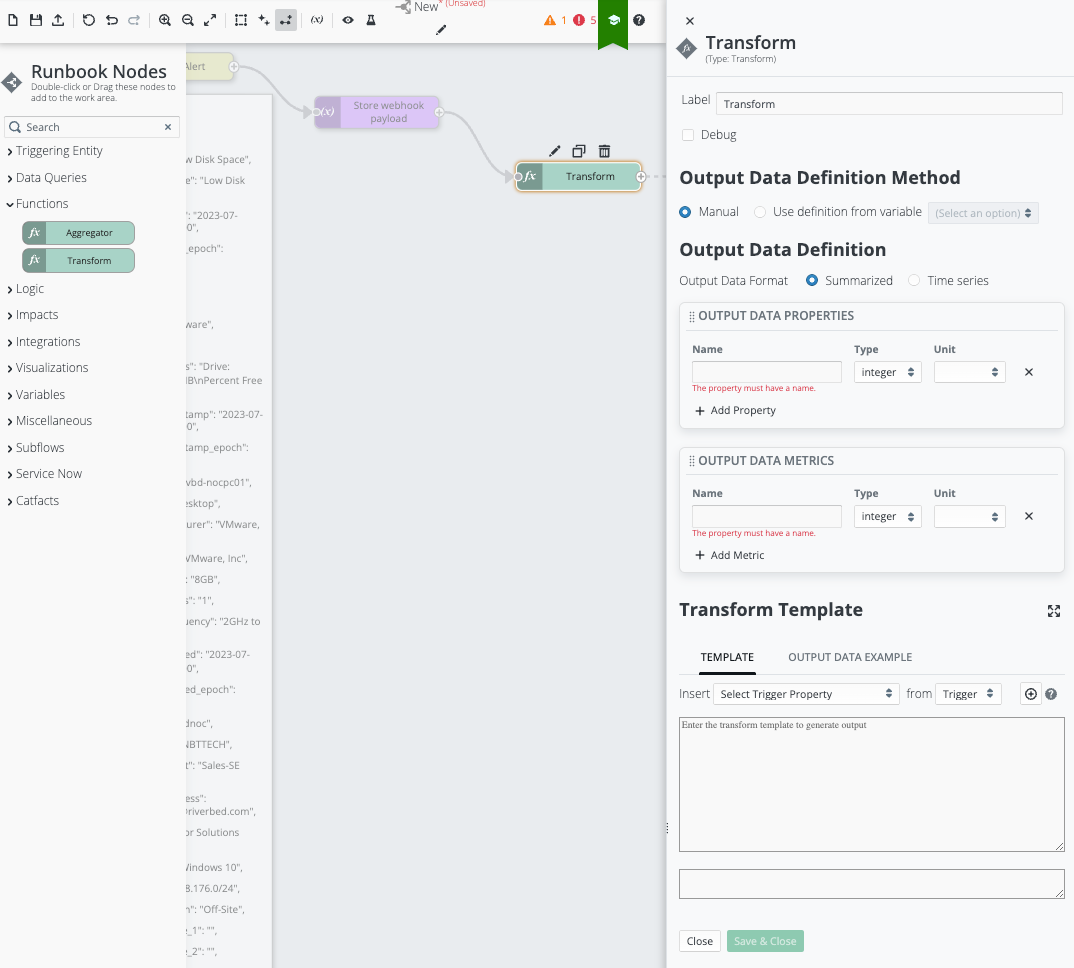
Functions: Transform: Properties Blade
Configuration of the Node to format the desired Runbook-runtime variables into a JSON-format
The Functions: Transform node, must be configured to format desired pre-defined Runbook-runtime variables into a JSON-format:
-
In the Functions: Transform editor-card on the right, the “Transform Template” area must first be configured with a Liquid-template that defines creation of new OUTPUT DATA PROPERTIES and the mapping of associated runtime variables:
Note: This area of the node configuration uses Liquid-templates to define data formats. Refer to Working With Liquid Templates.-
For this workflow, use the following Liquid-template to map the target Runbook-runtime variables into a JSON-format.
 Click to reveal template
Copy
Click to reveal template
Copy{
"data": [
{
"keys": {
"Alert_Name": "{{variables["runtime.alert_name"]}}",
"Date": "{{variables["runtime.alert_timestamp_epoch"] | date: '%Y-%m-%d--%H-%M-%S'}}",
"Event_Details": "{{variables["runtime.last_event_details"]}}",
"Category": "{{variables["runtime.category"]}}",
},
"data": {}
}
],
"info": {
"keys": [
{
"id": "Alert_Name",
"label": "Alert Name",
"type": "string",
"unit": ""
},
{
"id": "Date",
"label": "Date",
"type": "string",
"unit": ""
},
{
"id": "Event_Details",
"label": "Event Details",
"type": "string",
"unit": ""
},
{
"id": "Category",
"label": "Category",
"type": "string",
"unit": ""
}
],
"metrics": []
}
} -
-
Next, in the Functions: Transform editor card on the right, go to the OUTPUT DATA PROPERTIES area and add a Property for each of the target Runbook runtime-variables (i.e. enter the Name, Type, and Unit as appropriate for each):

-
Click “Save & Close” to save this node configuration.
C2: Visualizations: Table - Display Alert Summary
Over the course of execution, there are points in an automation work-flow where it is useful to surface the information gathered or generated by the runbook. The runbook Visualization![]() A runbook node category that shows data in a chart, graph, table, or note, providing visual representation of analysis results in runbook output. nodes provide a means for a runbook to surface information in a number of formats including the following:
A runbook node category that shows data in a chart, graph, table, or note, providing visual representation of analysis results in runbook output. nodes provide a means for a runbook to surface information in a number of formats including the following:
-
Table
-
Pie Chart
-
Bar Chart
-
Timeseries Chart
-
Bubble Chart
-
Correlation Chart
-
Cards
-
Gauges
-
Connection Graph
-
Debug
-
Text
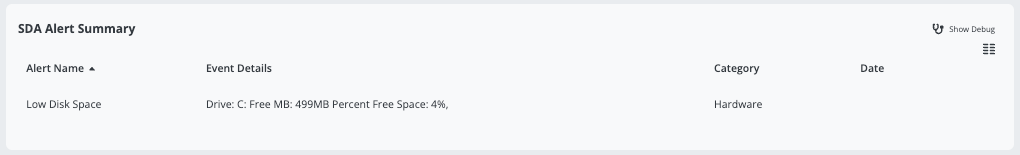
This runbook uses the Visualizations: Table node to surface summary information about the SDA Alert that triggered![]() A set of one or more indicators that have been correlated based on certain relationships, such as time, metric type, application affected, location, or network device. this specific runbook execution. The information collected includes the following:
A set of one or more indicators that have been correlated based on certain relationships, such as time, metric type, application affected, location, or network device. this specific runbook execution. The information collected includes the following:
-
Alert Name
-
Date
-
Event Details
-
Category
Placement of the Visualizations: Table node on the canvas in the Runbook Editor
There are two methods to place the Visualizations: Table node in the canvas of the Runbook Editor.
-
Find Visualizations: Table in the palette on the left-side of the Runbook Editor and drag it onto the canvas to the right of the Functions: Transform node:
-
The Functions: Transform node provides JSON formatted information as input for the Visualizations: Table node. Connect the data flow from Functions: Transform to Visualizations: Table.
-
-
Alternatively, click the plus sign on the Functions: Transform node to reveal a pop-up menu of relevant nodes. Then, find and select the Visualizations: Table node.
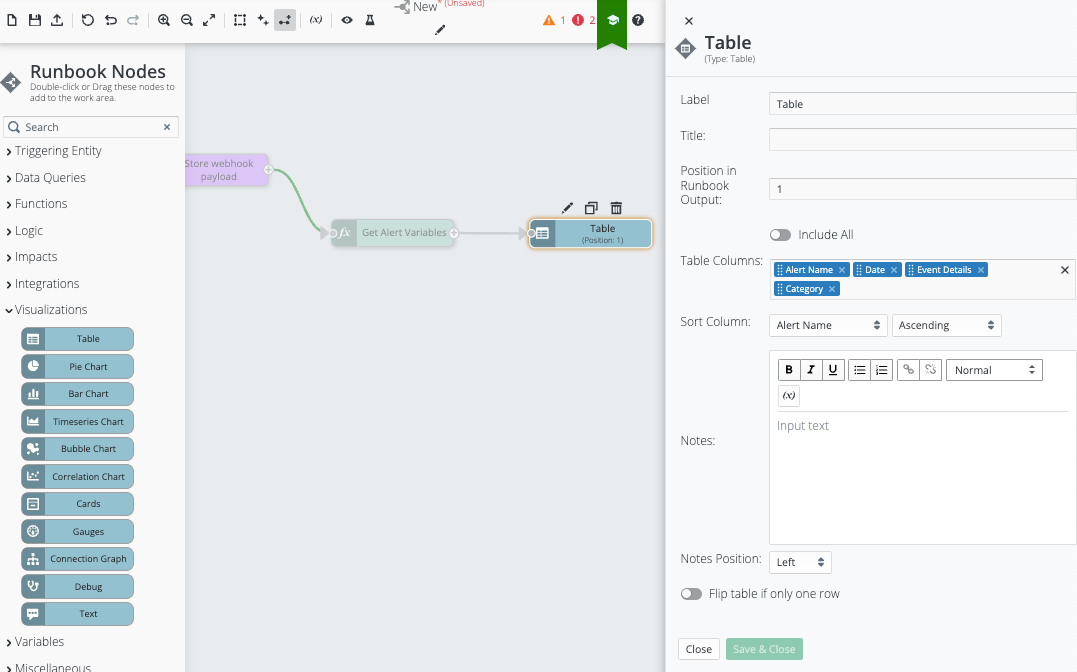
Visualizations: Table: Placement on the canvas
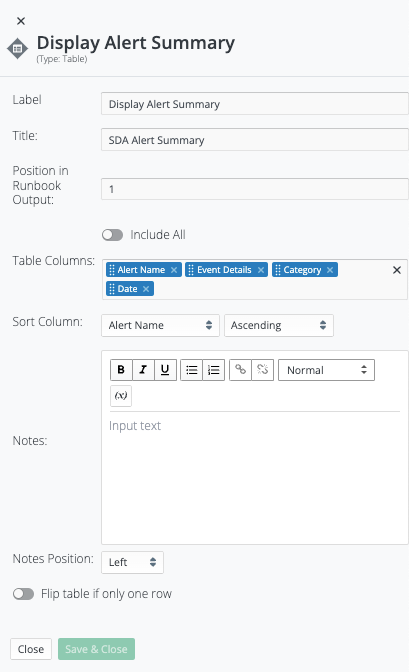
Configuration of the Node to surface the desired information
By default, the Visualizations: Table node surfaces all JSON parameters passed from the preceding node.
The Visualizations: Table node can also be configured to only surface certain JSON-parameters passed from the preceding node:
-
In the Visualizations: Table editor card on the right:
-
Go to the “Table Columns” area to review the available JSON parameters. Remove any that do not need to be surfaced.
-
Go to the “Sort Column” area to set the desired sort column and the desired sort order.
-
Make any other desired changes.
-
-
Click “Save & Close” to save this node configuration.
The Visualizations: Table is configured to parse this JSON and surface as a table similar to: