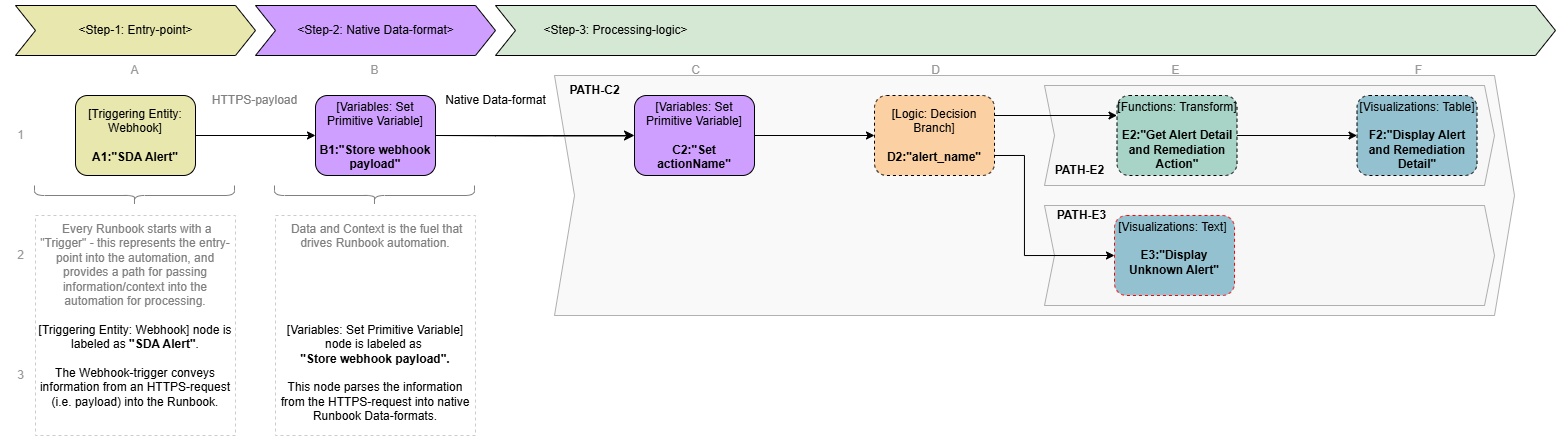
Path-C2: Parse Requested Action and Process
Overview
This parallel logic![]() A runbook node category that adds conditions to branch the runbook, enabling conditional execution paths based on data and context. path processes the information passed in by the external/third-party entity
A runbook node category that adds conditions to branch the runbook, enabling conditional execution paths based on data and context. path processes the information passed in by the external/third-party entity![]() Things deployed in the customer environment that are needed to run the business, such as applications, devices, interfaces, and locations. (via HTTP Request Body) to determine if it is a known alert type and if there is an available remediation action.
Things deployed in the customer environment that are needed to run the business, such as applications, devices, interfaces, and locations. (via HTTP Request Body) to determine if it is a known alert type and if there is an available remediation action.
C2: Set actionName (a Variables: Set Primitive Name runbook Node) analyzes the runbook setting runtime.alert_name (refer to Webhook Runbook Step-1: Entry-point) to determine an associated remediation (i.e. if found, store the associated remediation in variable runtime.actionName).
D2: alert_name (a Logic: Decision Branch runbook Node) analyzes the supplied Alert Name to determine processing path.
Path-E2: Logic sub-path that executes when the runbook receives alert_name: Low Disk Space.
E2: Get Alert Detail and Remediation Action (a Functions: Transform runbook Node) converts the runbook runtime-variables as output![]() A document containing data sets generated by the execution of a runbook, including output of queries and reports from point products, as well as output of analysis or other runbook nodes. properties of this node (that get passed to subtending nodes).
A document containing data sets generated by the execution of a runbook, including output of queries and reports from point products, as well as output of analysis or other runbook nodes. properties of this node (that get passed to subtending nodes).
F2: Display Alert and Remediation Detail (a Visualizations: Table runbook Node) displays certain Alert information in a table.
Path-E3:Logic sub-path that executes when the runbook receives an unknown alert_name.
E3: Display Unknown Alert (a Visualizations: Text runbook Node) displays unknown Alert information in text.
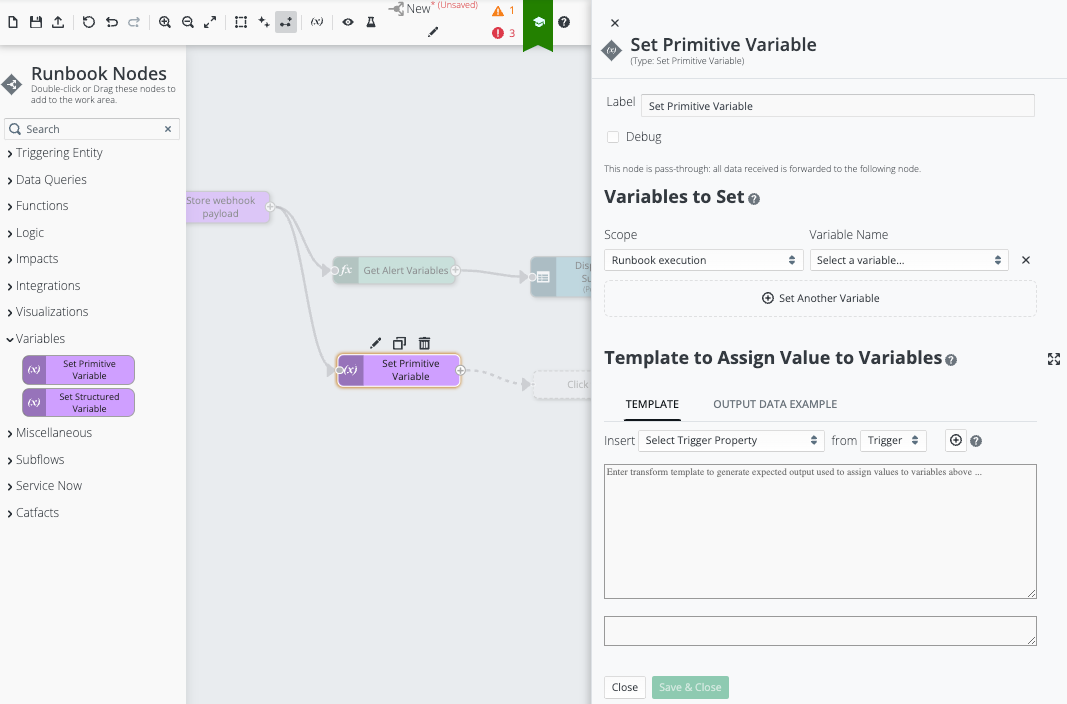
C2: Variables: Set Primitive Variable - Set actionName
This runbook Node analyzes the setting of a runbook Variable (runtime.alert_name) to initialize another runbook Variable: runtime.actionName.
The Variables: Set Primitive Variable node is configured with a Liquid Template that analyzes the setting of runtime.alert_name and sets runtime.actionName accordingly. Automation![]() Automated procedures that are executed as the result of a trigger. Automations consist of a single entry point and a sequence of connected nodes that define the processing logic. can then access the new runbook runtime.actionName variable for processing.
Automated procedures that are executed as the result of a trigger. Automations consist of a single entry point and a sequence of connected nodes that define the processing logic. can then access the new runbook runtime.actionName variable for processing.
Placement of the Variables: Set Primitive Variable node on the Canvas in the Runbook Editor
There are two methods to place the Variables: Set Primitive Variable node in the canvas of the Runbook Editor.
-
Find Variables: Set Primitive Variable in the palette on the left-side of the Runbook Editor and drag it onto the canvas to the right of the preceding Variables: Set Primitive Variable node:
-
The preceding Variables: Set Primitive Variable node will provide the data and context input for the Variables: Set Primitive Variable node. Connect the data flow from preceding Variables: Set Primitive Variable to Variables: Set Primitive Variable
-
-
Alternatively, click on the plus sign on the preceding Variables: Set Primitive Variable node (already on the canvas) to reveal a pop-up menu of relevant nodes. Then, find and select the Variables: Set Primitive Variable node.
Variables: Set Primitive Variable: Placement on the canvas
Configuration of the Node to identify a Remediation Action based on the received Alert Name
The Variables: Set Primitive Variable node, must be configured with a Liquid Template to analyze the setting of runtime.alert_name, and sets runtime.actionName accordingly:
-
In the Variables: Set Primitive Variable editor card on the right, go to the “Variables to Set” area and:
-
Press “Set another Variable” to add the predefined Runbook runtime variable runtime.actionName to this node:
-
Ensure Scope: Runbook execution is selected.
-
Then, find and specify Variable Name: runtime.actionName
-
-
-
Next, configure the “Template to Assign Value to Variables” area.
Note: This area of the node configuration uses Liquid-templates to define data formats and processing logic. Refer to Working With Liquid Templates.-
This runbook Node uses the following Liquid template to map the runtime.alert_name setting (parsed out of the HTTP-Request Body earlier), to an associate remediation action (i.e. runtime.actionName): (the following Liquid-template can be copy-pasted into the TEMPLATE-panel)
 Click to reveal template
Copy
Click to reveal template
Copy{% assign alert_name = variables["runtime.alert_name"] %}
{
{% if alert_name == "Low Disk Space" %}
"runtime.actionName": "Empty Recycle Bin1"
{% elsif alert_name == "Weak WiFi" %}
"runtime.actionName": "weakWifiAction"
{% else %}
"runtime.actionName": "noActionName"
{% endif %}
}
-
-
Click “Save & Close” to save this node configuration.
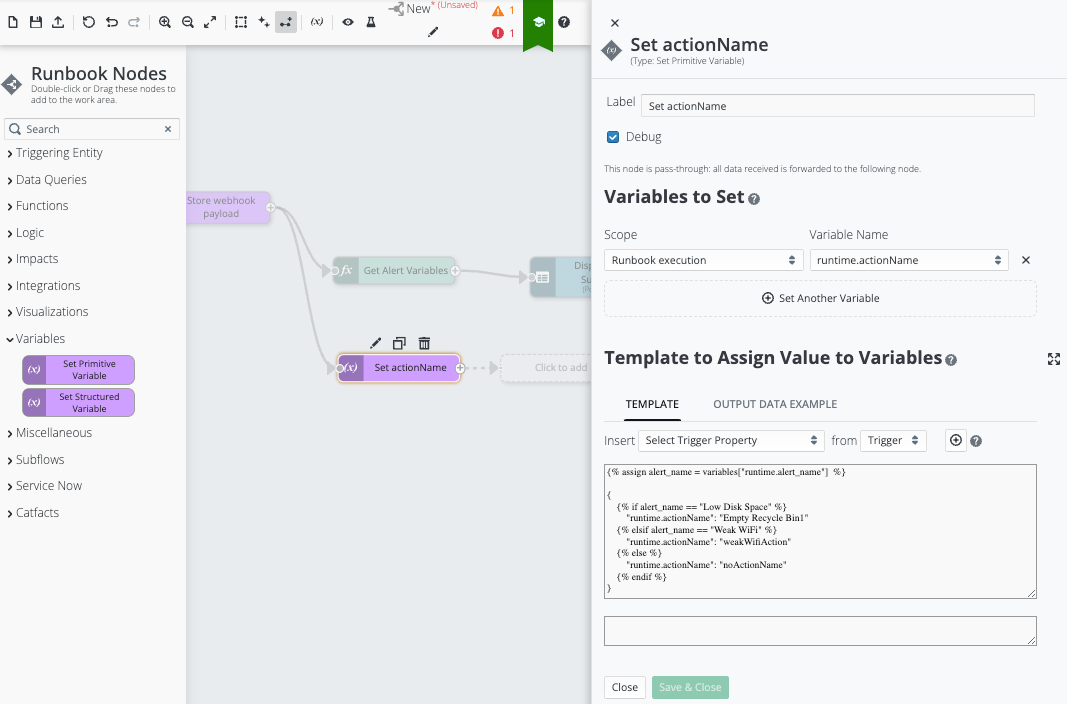
Variables: Set Primitive Variable: Configured (and Customized)
D2: Logic: Decision Branch - alert_name
At times there is a need for an automation to “pivot” the execution path based on gathered information. The Logic: Decision Branch Runbook Node provides a mechanism to specify the path of execution based upon some test or condition.
You can configure the Logic: Decision Branch Runbook Node to direct the path of execution through a specific Output based on a configured Condition. You can also configure multiple Output values to define different execution paths that match specific Condition values. Additionally, the Runbook supports a DEFAULT output to handle scenarios where no other condition matches.
For this Runbook, the Logic: Decision Branch Runbook Node is configured to determine two paths of execution:
-
Path-E2: The sub-path that is executed when alert_name: Low Disk Space.
-
Path-E3: (Default) The sub-path that is executed when an unknown alert_name is received (i.e. alert_name.NOT.Low Disk Space)
Placement of the Logic: Decision Branch node on the canvas in the Runbook Editor
There are two methods to place the Logic: Decision Branch node in the canvas of the Runbook Editor.
-
Find Logic: Decision Branch in the palette on the left-side of the Runbook Editor and drag it onto the canvas to the right of the Variables: Set Primitive Variable node:
-
the Variables: Set Primitive Variable node, as well as all preceding runbook Nodes in the path of execution, will provide the data and context input for the Logic: Decision Branch node. Connect the data flow from Variables: Set Primitive Variable to Logic: Decision Branch
-
-
Alternatively, click on plus sign on the Variables: Set Primitive Variable node (already on the canvas) to reveal a pop-up menu of relevant nodes. Then, find and select the Logic: Decision Branch node.
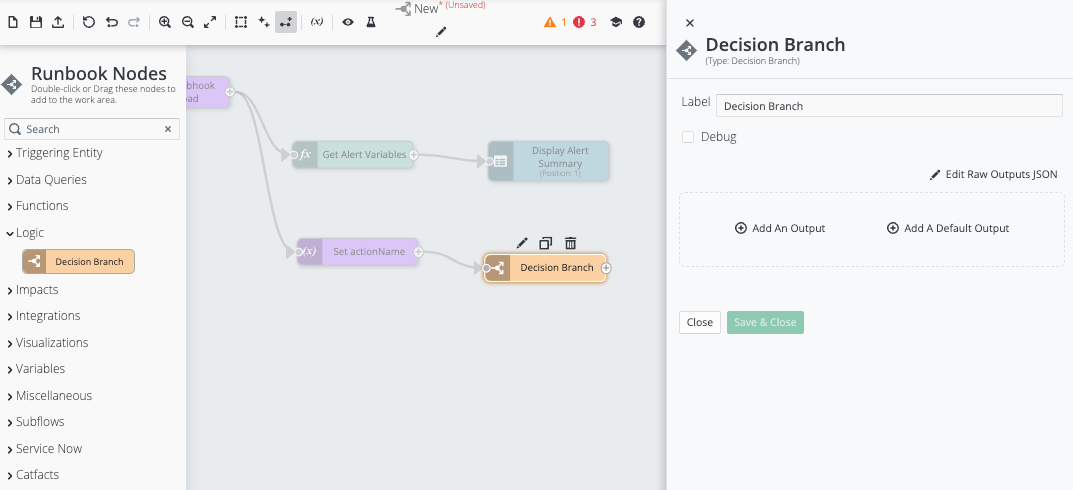
Logic: Decision Branch: Placement on the canvas
Configuration of the Node to direct path of execution based on a Condition
The Logic: Decision Branch node, is configured to determine path of execution based on the requested Alert (i.e. the setting for the variable runtime.alert_name that was parsed out of the HTTP-Request Body that initiated this runbook execution):
-
In the Logic: Decision Branch editor card on the right, go to the OUTPUT area:
-
Use the Add An Output control to configure an OUTPUT that will identify a specific path of execution for scenarios where runtime.alert_name: Low Disk Space:
-
Click the Add a Condition sub-control to configure the condition for following this path of execution as:
-
Select Variables from the pick list.
-
Select Variable: runtime.alert_name from the pick list.
-
Select Operation: equals.
-
Specify the value that must be matched to follow this path of execution (i.e. change “Click to add value” to “Low Disk Space”.)
-
-
-
-
In the Logic: Decision Branch editor card on the right, go to the OUTPUT area and:
-
Use the Add A Default Output control to configure a DEFAULT output that will identify the default path of execution for scenarios where runtime.alert_name is unknown.
-
-
Click “Save & Close” to save this node configuration.
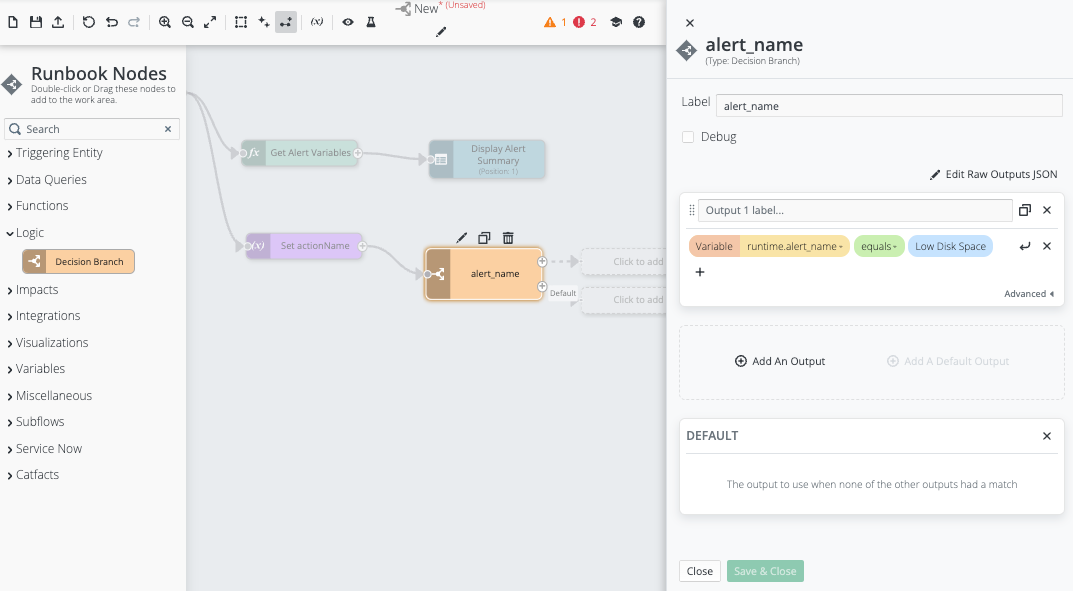
Logic: Decision Branch: Configured (and Customized)
Path-E2: Logic sub-path that is executed when [alert_name: Low Disk Space]
E2: Functions: Transform - Get Alert Detail and Remediation Action
You can use the Functions: Transform node to format data needed by a runbook automation into a JSON format. The runbook can use that JSON data to provide native input to another node.
For example, if transforming a set of runbook runtime variables into a JSON format. The transformation is performed according to the Transform Template defined in the Functions: Transform node.
Place the Functions: Transform node on the canvas in the Runbook Editor
There are two methods to place the Functions: Transform node in the canvas of the Runbook Editor.
-
Find Functions: Transform in the palette on the left-side of the Runbook Editor and drag it onto the canvas to the right of the Logic: Decision Branch node:
-
The Logic: Decision Branch node is precursor for the Functions: Transform node, and the Functions: Transform node is the first node in the sub-path for processing of a known Alert (i.e. alert_name: Low Disk Space). Connect the data flow from Logic: Decision Branch to Functions: Transform
-
-
Alternatively, click on the plus sign on the Logic: Decision Branch node for first Output (already on the canvas) to reveal a pop-up menu of relevant nodes. Then, find and select the Functions: Transform node.
Note: this method automatically connects the data flow from Variables: Set Primitive Variable to Functions: Transform.
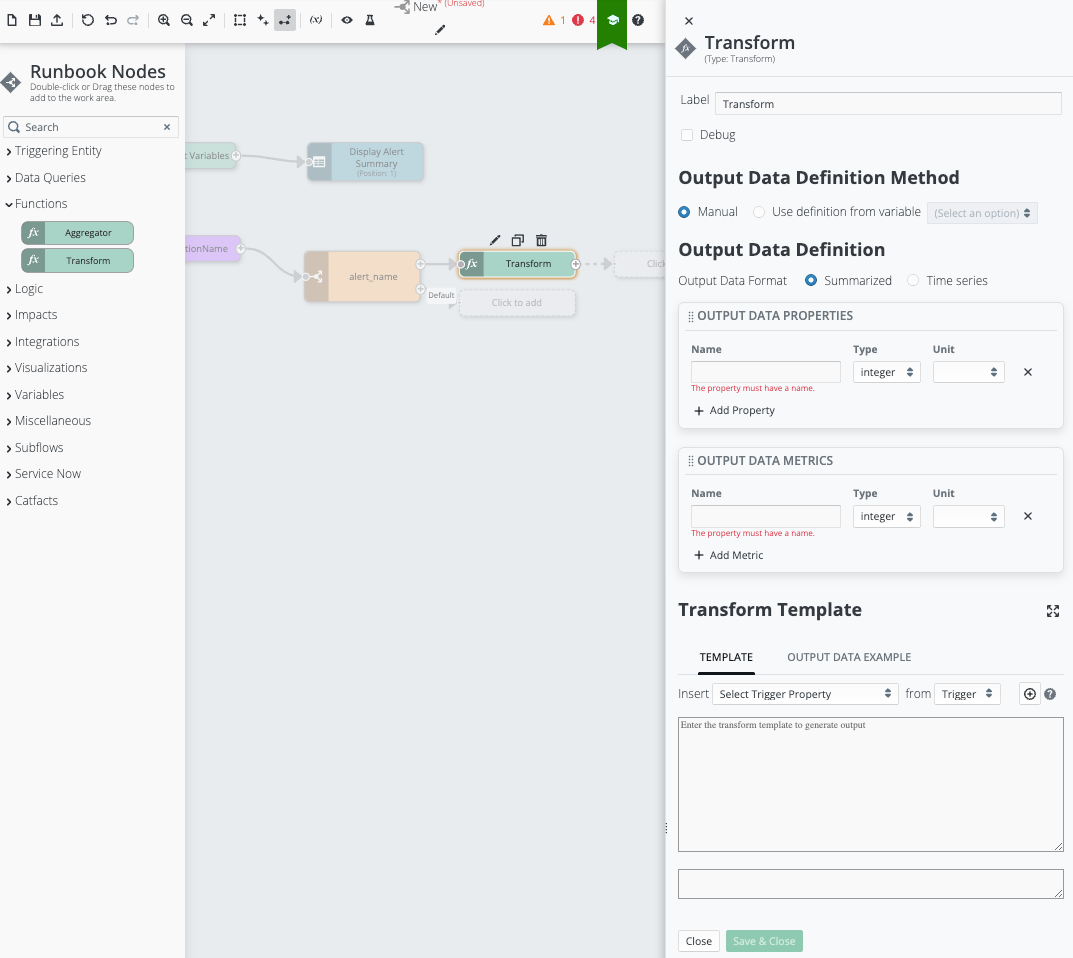
Functions: Transform: Properties Blade
E2: Configuration of the Node to format the specified Runbook runtime variables into a JSON-format
The Functions: Transform node, must be configured to format desired predefined Runbook runtime-variables into a JSON-format:
-
In the Functions: Transform editor card on the right, the “Transform Template” area must first be configured with a Liquid template that defines creation of new OUTPUT DATA PROPERTIES and the mapping of associated runtime-variables:
Note: This area of the node configuration uses Liquid-templates to define data formats. Refer to Working With Liquid Templates.-
For this workflow, use the following Liquid-template to map the target Runbook runtime variables into a JSON format. (The following Liquid-template can be copy-pasted into the TEMPLATE-panel)
Click to reveal the template
Copy{
"data": [
{
"keys": {
"Alert_Name": "{{variables["runtime.alert_name"]}}",
"Alert_Event_Name": "{{variables["runtime.alert_event_name"]}}",
"Date": "{{variables["runtime.alert_timestamp_epoch"] | date: '%Y-%m-%d--%H-%M-%S'}}",
"Event_Details": "{{variables["runtime.last_event_details"]}}",
"Category": "{{variables["runtime.category"]}}",
"Device_Type": "{{variables["runtime.device_type"]}}",
"Device_Manufacturer": "{{variables["runtime.device_manufacturer"]}}",
"Device_Model": "{{variables["runtime.device_model"]}}",
"Username": "{{variables["runtime.username"]}}",
"Action_Name": "{{variables["runtime.actionName"]}}",
},
"data": {}
}
],
"info": {
"keys": [
{
"id": "Alert_Name",
"label": "Alert Name",
"type": "string",
"unit": ""
},
{
"id": "Alert_Event_Name",
"label": "Alert Event Name",
"type": "string",
"unit": ""
},
{
"id": "Date",
"label": "Date",
"type": "string",
"unit": ""
},
{
"id": "Event_Details",
"label": "Event Details",
"type": "string",
"unit": ""
},
{
"id": "Category",
"label": "Category",
"type": "string",
"unit": ""
},
{
"id": "Device_Type",
"label": "Device Type",
"type": "string",
"unit": ""
},
{
"id": "Device_Manufacturer",
"label": "Device Manufacturer",
"type": "string",
"unit": ""
},
{
"id": "Device_Model",
"label": "Device Model",
"type": "string",
"unit": ""
},
{
"id": "Username",
"label": "Username",
"type": "string",
"unit": ""
},
{
"id": "Action_Name",
"label": "Action Name",
"type": "string",
"unit": ""
}
],
"metrics": []
}
}
-
-
Next, in the Functions: Transform editor card on the right, go to the OUTPUT DATA PROPERTIES area and add a Property for each of the target runbook runtime variables (i.e. enter the Name, Type, and Unit as appropriate for each):
-
Click “Save & Close” to save this node configuration.
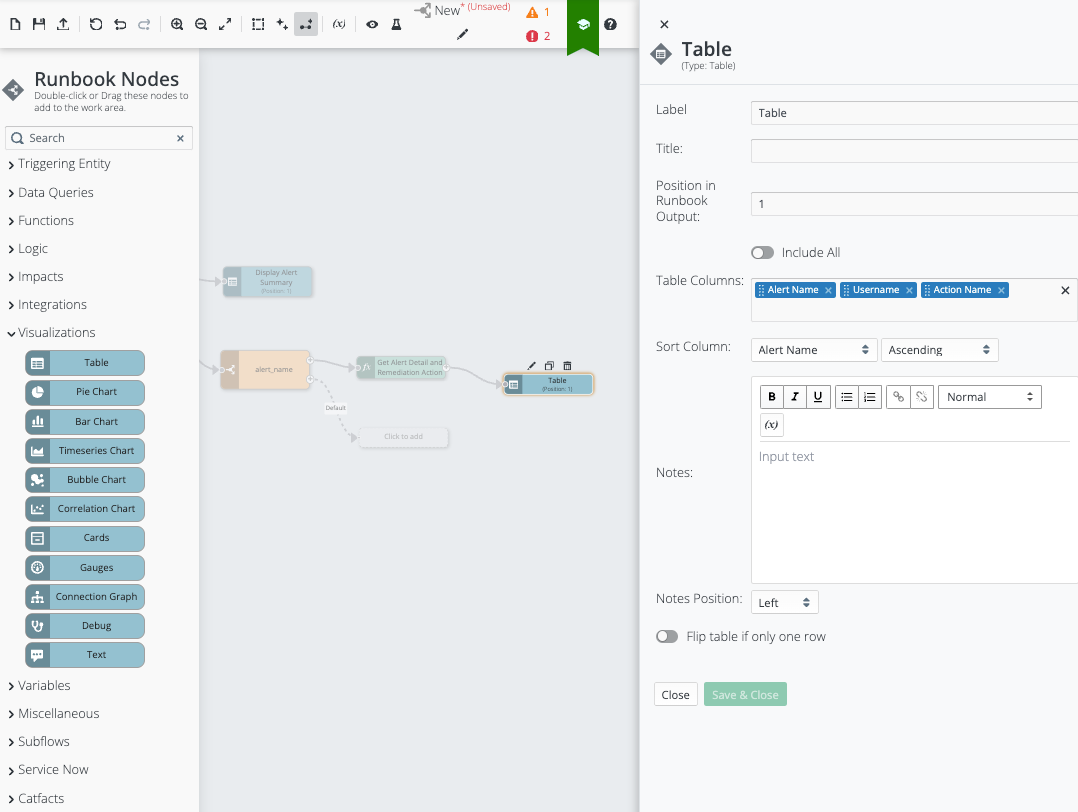
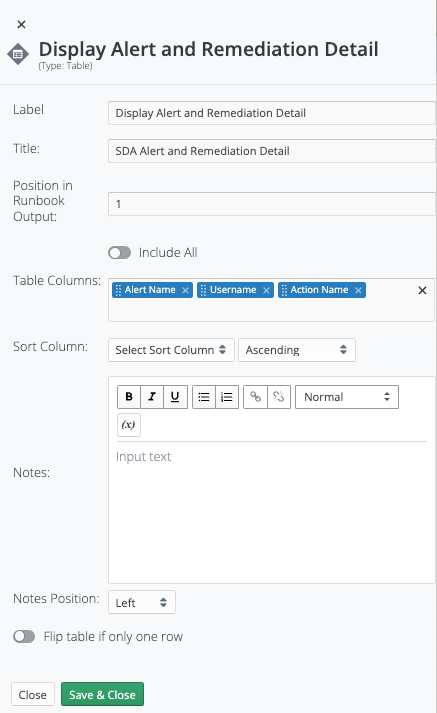
F2: Visualizations: Table - Display Alert and Remediation Detail
This runbook uses the Visualizations: Table node to surface summary information about the SDA Alert that triggered this specific runbook execution. The information collected includes the following:
-
Table
-
Pie Chart
-
Bar Chart
-
Timeseries Chart
-
Bubble Chart
-
Correlation Chart
-
Cards
-
Gauges
-
Connection Graph
-
Debug
-
Text
This runbook uses the Visualizations: Table node to surface more detailed information about the SDA Alert that triggered the specific runbook execution and the associated Remediation Action. The information collected includes:
-
Alert Name
-
Username
-
Action Name
Place the Visualizations: Table node on the canvas in the runbook Editor
There are two methods to place the Visualizations: Table node in the canvas of the runbook Editor.
-
Find Visualizations: Table in the palette on the left side of the runbook Editor and drag it onto the canvas to the right of the Functions: Transform node:
-
The Functions: Transform node will provide JSON formatted information as input for the Visualizations: Table node. Connect the data flow from Functions: Transform to Visualizations: Table.
-
-
Alternatively, click on the plus sign on the Functions: Transform node (already on the canvas) to reveal a pop-up menu of relevant nodes. Then, find and select the Visualizations: Table node.
Note: this method automatically connects the data flow from Functions: Transform to Visualizations: Table.
Visualizations: Table: Placement on the canvas
Configuration of the Node to surface the desired information
By default, the Visualizations: Table node will be configured to surface all JSON parameters passed from the preceding node.
The Visualizations: Table node can also be configured to only surface certain JSON parameters passed from the preceding node:
-
In the Visualizations: Table editor card on the right:
-
Go to the “Table Columns” area to review the available JSON parameters and remove any parameters that do not need to be surfaced.
-
Go to the “Sort Column” area to set the desired sort-column and the desired sort-order.
-
Make any other desired changes.
-
-
Click “Save & Close” to save this node configuration.
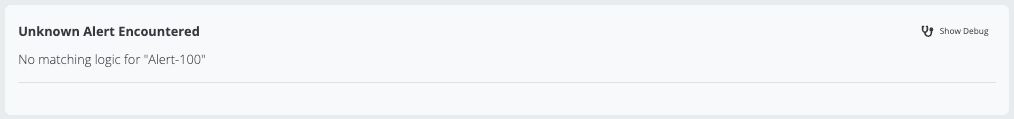
Path-E3: Logic sub-path that is executed when an unspecified alert_name is received
E3: Visualizations: Text - Display Unknown Alert
This runbook uses the Visualizations: Table node to surface summary information about the SDA Alert that triggered this specific runbook execution. The information collected includes the following:
-
Table
-
Pie Chart
-
Bar Chart
-
Timeseries Chart
-
Bubble Chart
-
Correlation Chart
-
Cards
-
Gauges
-
Connection Graph
-
Debug
-
Text
This runbook uses the Visualizations: Text node to log the occurrence of an unknown Alert:
-
Alert Name
E3: Placement of the Visualizations: Text on the canvas in the runbook Editor
There are two methods to place the Visualizations: Text node in the canvas of the runbook Editor.
-
Find Visualizations: Text in the palette on the left-side of the runbook Editor and drag it onto the canvas to the right of the Logic: Decision Branch node:
-
The Logic: Decision Branch node will provide JSON formatted information as input for the Visualizations: Text node. Connect the data flow from Logic: Decision Branch.OUTPUT: Default to Visualizations: Text.
-
-
Alternatively, click on the plus sign on the Logic: Decision Branch.OUTPUT: Default (already on the canvas) to reveal a pop-up menu of relevant nodes. Then, find and select the Visualizations: Text node.

Configuration of the Node to surface the desired information
By default, the Visualizations: Text node will be configured to surface the unknown Alert Name parsed from the HTTP-Request Body:
-
In the Visualizations: Text editor-card on the right:
-
Go to the “Notes” area and specify the Alert-log to be surfaced, (e.g. display the value stored in variable runtime.alert_name):
-
No matching logic for "{{variables"runtime.alert_name"}}"
-
Click “Save & Close” to save this node configuration.
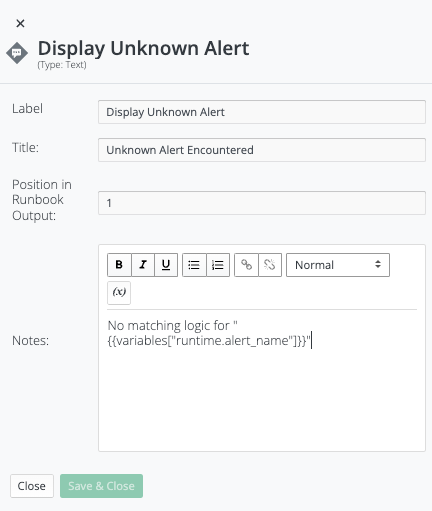
The Visualizations: Text is configured to surface Unknown Alert Name similar to: