Runbook Debugging Features
IQ Ops provides many features that make it easier to troubleshoot runbooks![]() An automated workflow that executes a series of steps or tasks in response to a triggered event, such as the detection of anomalous behavior generating an incident, a lifecycle event, or a manually executed runbook., understand execution flow, and identify issues. Use these features when you need to debug failed runbook executions, trace execution paths, or diagnose configuration problems. These features make it easier to enable and disable debug, provide clearer visual indicators, and offer more readable debug output.
An automated workflow that executes a series of steps or tasks in response to a triggered event, such as the detection of anomalous behavior generating an incident, a lifecycle event, or a manually executed runbook., understand execution flow, and identify issues. Use these features when you need to debug failed runbook executions, trace execution paths, or diagnose configuration problems. These features make it easier to enable and disable debug, provide clearer visual indicators, and offer more readable debug output.
Debug Configuration Dialog
The Runbook Editor toolbar includes a debug configuration tool that opens a dialog for managing debug settings across all nodes![]() Individual components that make up a runbook automation, each performing a specific function such as data queries, transformations, logic, integrations, or visualizations. in your runbook. This dialog makes it easier to enable or disable debug on multiple nodes at once, rather than configuring each node individually.
Individual components that make up a runbook automation, each performing a specific function such as data queries, transformations, logic, integrations, or visualizations. in your runbook. This dialog makes it easier to enable or disable debug on multiple nodes at once, rather than configuring each node individually.
Using the Debug Configuration Dialog
To open the debug configuration dialog:
-
In the Runbook Editor, click the debug icon in the toolbar.
-
The debug configuration dialog opens, showing all nodes in your runbook listed alphabetically.
Dialog Features
The debug configuration dialog provides the following features:
-
Alphabetical node listing: All nodes are displayed in alphabetical order to make navigation easier.
-
Clear node identification: Each node displays its category and type (for example, Data Queries > Applications) to help you identify the correct node.
-
Bulk operations: Use the Uncheck All link at the bottom right to quickly disable debug on all nodes.
-
Enable All Highlighted: If you have selected nodes on the canvas before opening the dialog, an Enable All Highlighted link appears. Clicking this link enables debug for all the nodes you selected on the canvas.
After making your selections, click Apply to save your debug settings.
Visual Indicators for Debug Status
Visual indicators make it immediately obvious when debug is enabled on nodes, helping you avoid leaving debug unintentionally enabled in production runbooks.
Node Canvas Indicators
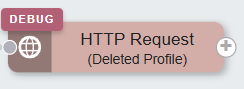
When you enable debugging on a node, a Debug flag appears on the corner of that node in the Runbook Editor canvas.
Save Dialog Warning
When you click Save in the Runbook Editor to save a runbook that has any nodes with debugging enabled, the Save Runbook dialog highlights that debugging is enabled and provides a quick way to disable it before saving. This warning only appears when at least one node has debugging enabled.
Debug Output Readability
Debug output provides more readable, formatted information that is easier to understand and troubleshoot. The node details dialog (opened from the Debug Runbook Flow diagram or from the stethoscope icon next to runbook output) includes the CONFIG tab, the INSPECT tab (formatted, structured view), and the DEBUG tab (Tree view and Text (JSON) view, with Tree view as the default). Some node types (Transform, HTTP, Set Primitive Variable, and GenAI) provide a specialized Inspect tab that organizes debug data into sections tailored to that node. For details about the Inspect tab and specialized views by node type, see Debug Inspect Tab by Node Type. For the Node dropdown, tabs, and both ways to open the dialog, see Viewing Node Details in Debug Runbook Flow.
Error Messages
Debugging error messages have clear, descriptive messages that explain what went wrong and, when applicable, what you can do to fix the issue.
For a full list of debugging error codes, see Runbook Debug Error Codes.
Subflow Debugging
Debugging capabilities have been enhanced for runbooks that use subflows![]() A reusable automation chunk that performs frequently used functions, such as opening a ticket in an external system, and can be used to implement integrations with third-party systems., making it easier to troubleshoot issues that occur within subflow execution. For details about the subflow debug tree view, node selection, and viewing debug info for nodes inside a subflow, see Subflow Debugging.
A reusable automation chunk that performs frequently used functions, such as opening a ticket in an external system, and can be used to implement integrations with third-party systems., making it easier to troubleshoot issues that occur within subflow execution. For details about the subflow debug tree view, node selection, and viewing debug info for nodes inside a subflow, see Subflow Debugging.