Debug Inspect Tab by Node Type
When viewing debug information for a node in the node details dialog (from the Debug Runbook Flow diagram or from the stethoscope icon next to runbook output), you use the INSPECT and DEBUG tabs. The INSPECT tab provides formatted, structured debug output![]() A document containing data sets generated by the execution of a runbook, including output of queries and reports from point products, as well as output of analysis or other runbook nodes.. Some node
A document containing data sets generated by the execution of a runbook, including output of queries and reports from point products, as well as output of analysis or other runbook nodes.. Some node![]() Individual components that make up a runbook automation, each performing a specific function such as data queries, transformations, logic, integrations, or visualizations. types provide a specialized Inspect tab that organizes debug data into sections tailored to that node. This topic describes the Inspect tab in general and the specialized Inspect views for Transform, HTTP, Set Primitive Variable, and GenAI nodes.
Individual components that make up a runbook automation, each performing a specific function such as data queries, transformations, logic, integrations, or visualizations. types provide a specialized Inspect tab that organizes debug data into sections tailored to that node. This topic describes the Inspect tab in general and the specialized Inspect views for Transform, HTTP, Set Primitive Variable, and GenAI nodes.
For an overview of runbook![]() An automated workflow that executes a series of steps or tasks in response to a triggered event, such as the detection of anomalous behavior generating an incident, a lifecycle event, or a manually executed runbook. debugging features, see Runbook Debugging Features.
An automated workflow that executes a series of steps or tasks in response to a triggered event, such as the detection of anomalous behavior generating an incident, a lifecycle event, or a manually executed runbook. debugging features, see Runbook Debugging Features.
Debug Output Tabs
The INSPECT and DEBUG tabs show a node's debug output. The node details dialog also includes the CONFIG tab and the Error tab when applicable. For the debug output tabs:
-
INSPECT tab: Formatted, structured debug output that presents information in an organized, easy-to-read format. The INSPECT tab is the default view when you are reviewing debug data and provides the most user-friendly presentation of debug data.
-
DEBUG tab: Raw debug output in a Tree view and a Text (JSON) view of the same data. Tree view is the default. Use the control in the tab to switch between Tree view and Text view.
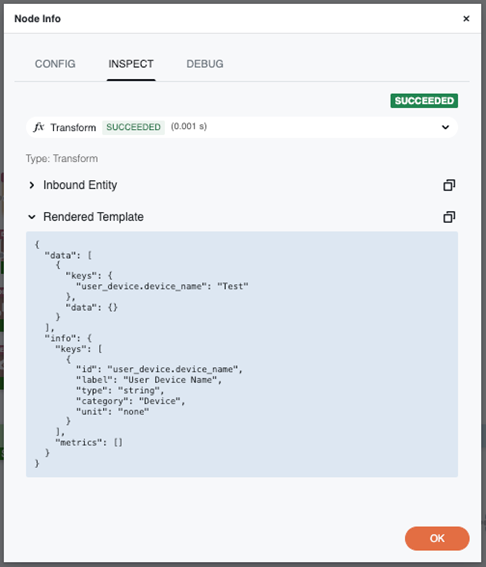
Transform Node Inspect Tab
The Transform node provides a specialized Inspect tab that organizes transform debug data into structured sections. This enhanced debug view displays transform input/output data with automatic validation of the rendered Liquid template against the expected output data format.
![]()
The Transform node Inspect tab organizes debug data into the following sections:
-
Error and Warning banners: When a transform error is reported, an error banner is displayed at the top of the tab using red/danger styling for immediate visibility. Validation findings are displayed as warning banners with yellow/orange background.
-
Inbound Entity Section: The input data that was passed to the transform node. This section is collapsed by default.
-
Rendered Template Section: The output data after the Liquid template has been rendered. This section is expanded by default.
Additional features:
-
Copy to Clipboard: Each section includes a copy button to quickly copy section content.
-
Collapsible Sections: All sections, except for top banners, can be expanded/collapsed individually.
-
Conditional Display: Each section is displayed only if data is available for it.
HTTP Node Inspect Tab
The HTTP node provides a specialized Inspect tab that displays formatted, structured views of HTTP request/response data. The Inspect tab displays data in a collapsible tree view format, with JSON data automatically formatted for readability.
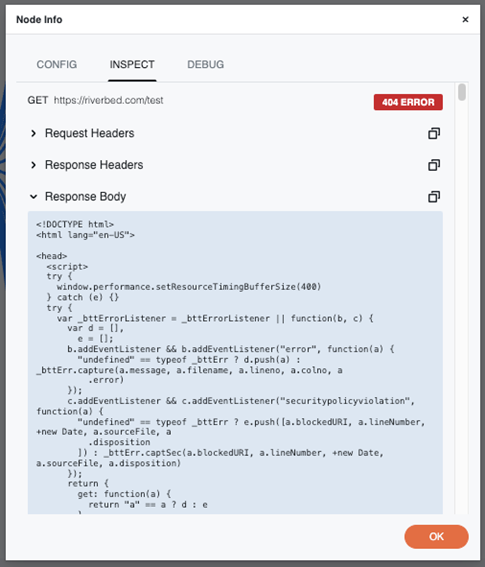
The HTTP node Inspect tab organizes debug data into the following sections:
-
Error banner: When an error is reported, an error banner is displayed at the top of the tab using red/danger styling for immediate visibility.
-
Request Section:
Note: When rendered, variables in the URL and headers are resolved and the request body template is shown.-
Request Overview: Displays HTTP method (GET, POST, PUT, DELETE, etc.) and full URL. Variables in the URL are resolved to their actual values.
-
Request Headers: All HTTP request headers (collapsed by default). Variables in headers are resolved to their actual values.
-
Request Body: The request payload/body content (expanded by default). The request body template is shown after rendering, with all variables resolved to their actual values.
-
-
Response Section:
-
Response Status: HTTP status code with color-coded badge. Green (2xx), Yellow/Orange (3xx), Red (4xx/5xx).
-
Response Headers: All HTTP response headers (collapsed by default).
-
Response Body: The response payload/body content (expanded by default).
-
Additional features:
-
Copy to Clipboard: Each section includes a copy button to quickly copy section content.
-
Collapsible Sections: All sections, except for the error banner and request overview, can be expanded/collapsed individually.
-
Conditional Display: Each section is displayed only if data is available for it.
Set Primitive Variable Node Inspect Tab
The Set Primitive Variable node provides a specialized Inspect tab that organizes debug data for variable assignment into structured sections. This view displays the input passed to the node, the rendered Liquid template output, and the variables that were set.
The Set Primitive Variable node Inspect tab organizes debug data into the following sections:
-
Error banner: When an error is reported, an error banner is displayed at the top of the tab using red/danger styling for immediate visibility.
-
Inbound Entity Section: The input data that was passed to the Set Primitive Variable node. This section is collapsed by default.
-
Rendered Template Section: The output after the Liquid template has been rendered (the values assigned to the variables). This section is expanded by default.
Additional features:
-
Copy to Clipboard: Each section includes a copy button to quickly copy section content.
-
Collapsible Sections: All sections, except for the error banner, can be expanded/collapsed individually.
-
Conditional Display: Each section is displayed only if data is available for it.
GenAI Node Inspect Tab
The GenAI![]() Generative AI. Artificial intelligence technology that can generate new content, such as text, based on learned patterns from training data. node provides a specialized Inspect tab that organizes debug data for generative AI requests and responses into structured sections. This view displays the instructions and query sent to the model, optional inference configuration, the model response, and token usage metadata returned by the service.
Generative AI. Artificial intelligence technology that can generate new content, such as text, based on learned patterns from training data. node provides a specialized Inspect tab that organizes debug data for generative AI requests and responses into structured sections. This view displays the instructions and query sent to the model, optional inference configuration, the model response, and token usage metadata returned by the service.
The GenAI node Inspect tab organizes debug data into the following sections:
-
Error banner: When an error is reported, an error banner is displayed at the top of the tab using red/danger styling for immediate visibility.
-
Request Section: The instructions (system prompt) and query sent to the generative AI model. This section may be collapsed by default.
-
Inference configuration: When inference parameters were set on the node or returned for the run, this section shows the effective values (for example, maxTokens, temperature, topP, topK, stopSequences, and reasoningConfig). It may be collapsed by default.
-
Response Section: The content returned by the generative AI model. This section is expanded by default.
-
Usage: Token usage for the invocation, when the service returns a usage object (including Amazon Bedrock-style usage). Fields include InputTokens, OutputTokens, TotalTokens, CacheReadInputTokenCount, and CacheWriteInputTokenCount (the cache counts apply when prompt caching is in use). The same data is available in the DEBUG tab as raw output.
Additional features:
-
Copy to Clipboard: Each section includes a copy button to quickly copy section content.
-
Collapsible Sections: All sections, except for the error banner, can be expanded/collapsed individually.
-
Conditional Display: Each section is displayed only if data is available for it.