Execution Summary Flows
The following Flows describe how the Riverbed IQ Ops traverses the example Runbook![]() An automated workflow that executes a series of steps or tasks in response to a triggered event, such as the detection of anomalous behavior generating an incident, a lifecycle event, or a manually executed runbook. in different scenarios and the resulting Runbook Analysis.
An automated workflow that executes a series of steps or tasks in response to a triggered event, such as the detection of anomalous behavior generating an incident, a lifecycle event, or a manually executed runbook. in different scenarios and the resulting Runbook Analysis.
Flow-1: Interface goes DOWN
-
New Incident
-
Interface-X streams Metric
 A measurement or data point that is monitored and analyzed to detect anomalies and generate incidents.: Interface Status The current state of an incident or runbook, indicating its progress through investigation and resolution workflows.(DOWN)
 -
Riverbed IQ Ops detects an anomaly
An unexpected event or measurement that does not match the expected model. on Interface-X (i.e. Metric: Interface Status(DOWN) and generates a Primary Indicator An observed change in a specific metric stream that is recognized as being outside of an expected model. Indicators are correlated into triggers, and one or more triggers are grouped into incidents.. -
Riverbed IQ Ops checks if there are any Correlated Indicators (i.e. any other related anomalies) for Interface-X.
-
Riverbed IQ Ops groups the Primary Indicator with any Correlated Indicators for Interface-X and creates an Interface Incident.
-
-
Creation of a new Interface Incident triggers
A set of one or more indicators that have been correlated based on certain relationships, such as time, metric type, application affected, location, or network device. the execution of an associated Interface Incident Runbook.-
Entry-point
-
The Triggering Entity: Interface node
Individual components that make up a runbook automation, each performing a specific function such as data queries, transformations, logic, integrations, or visualizations. provides Primary Indicator data/context as trigger-data that constitutes initial conditions for Runbook execution, i.e. Primary Indicator: {Interface-X, Metric: Interface Status(DOWN), …}
-
-
Processing-logic
-
The Logic: Decision Branch analyzes the trigger-data to determine the path of execution, determines that an investigation into a DOWN Interface must be performed (i.e. Triggering Metric: Interface Status), and directs Runbook execution through OUTPUT-1 (i.e. Path-1):
-
The Data Query: Interface Status node gathers one hour's worth of time series data/context for Metric: Interface Status on the triggering Interface-X.
-
The Visualizations: Timeseries Chart node generates an Area-graph of the one hour's worth of time series data/context for Metric: Interface Status on the triggering Interface-X (supplied by preceding Data Query: Interface Status node).
-
-
-
-
Runbook Analysis
-
The resulting Timeseries Area-graph of the one hour's worth of time series data/context for Metric: Interface Status on the triggering Interface-X is rendered in the following visualization:
-
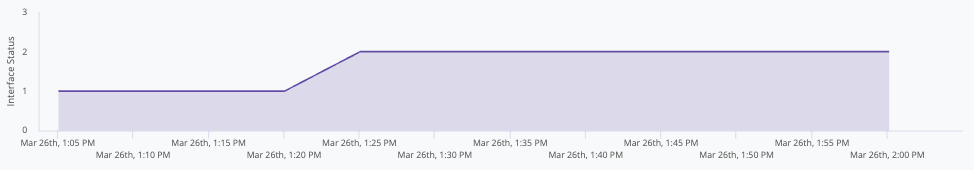
Visualization: Timeseries Chart for Metric: Interface Status
Flow-2: Interface encounters Packet Errors
-
New Incident
-
Interface-X streams Metric: In Packet Errors(50%).
-
Riverbed IQ Ops detects anomaly on Interface-X (i.e. Metric: In Packet Errors(50%) is higher than expected) and generates a Primary Indicator.
-
Riverbed IQ Ops checks to determine if there are any Correlated Indicators (i.e. any other related anomalies) for Interface-X.
-
Riverbed IQ Ops groups the Primary Indicator with any Correlated Indicators for Interface-X and creates an Interface Incident.
-
-
Creation of a new Interface Incident triggers the execution of an associated Interface Incident Runbook.
-
Entry-point
-
The Triggering Entity: Interface node provides Primary Indicator data/context as trigger-data that constitutes initial conditions for Runbook execution, i.e. Primary Indicator: {Interface-X, Metric: In Packet Errors(50%), …}.
-
-
Processing-logic
-
The Logic: Decision Branch analyzes the trigger-data to determine the path of execution, determines that an investigation into Interface Packet Errors must be performed (i.e. Metric: In Packet Errors), and directs Runbook execution through OUTPUT-2 (i.e. Path-2):
-
The Data Query: Network Interface node gathers one hour's worth of summary data/context for Metric: In Packets and Metric: Out Packets on the triggering Interface-X.
-
The Visualizations: Table node creates a table of the one hour's worth of summary data/context for Metric: In Packets and Metric: Out Packets on the triggering Interface-X (supplied by preceding Data Query: Network Interface node).
-
-
-
-
Runbook Analysis
-
The resulting table of the one hour's worth of summary data/context for Metric: In Packets and Metric: Out Packets on the triggering Interface-X is rendered in the following visualization:
-

Visualization: Table for Metric: In Packets and Metric: Out Packets