Interface Incident Runbook Overview
Riverbed IQ Ops Incident Runbooks are the set of automations that execute automatically when a new Incident surfaces. Depending on the Incident-type (e.g. Application, Device, Interface, …), there is an associated Runbook automation. For example, when Riverbed IQ Ops detects an Interface issue it creates an Interface Incident to surface the issue. The creation of the Incident triggers an associated Interface Runbook automation to perform further analysis/investigation (consisting of an “Entry-point”, and then “Processing-logic”) with the resulting Runbook Output/Analysis attached to the Incident.

Chronology of IQ Ops Workflow from Incident Creation, Runbook Execution (Entry-point and Processing-logic), to Runbook Output/Analysis
Introduction
The following sections explore the anatomy, functionality, and flow of the following Interface Incident Runbook Example:
Interface![]() An entity type representing network interfaces on devices that are monitored for performance metrics and anomalies. Incident
An entity type representing network interfaces on devices that are monitored for performance metrics and anomalies. Incident![]() A collection of one or more related triggers. Relationships that cause triggers to be combined into incidents include application, location, operating system, or a trigger by itself. Runbook
A collection of one or more related triggers. Relationships that cause triggers to be combined into incidents include application, location, operating system, or a trigger by itself. Runbook![]() An automated workflow that executes a series of steps or tasks in response to a triggered event, such as the detection of anomalous behavior generating an incident, a lifecycle event, or a manually executed runbook. Example
An automated workflow that executes a series of steps or tasks in response to a triggered event, such as the detection of anomalous behavior generating an incident, a lifecycle event, or a manually executed runbook. Example
This simple Runbook automatically performs the automation![]() Automated procedures that are executed as the result of a trigger. Automations consist of a single entry point and a sequence of connected nodes that define the processing logic. associated with Interface Incidents.
Automated procedures that are executed as the result of a trigger. Automations consist of a single entry point and a sequence of connected nodes that define the processing logic. associated with Interface Incidents.
High-level Structure
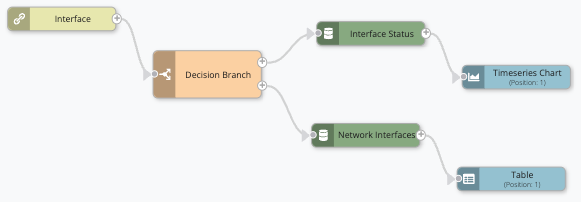
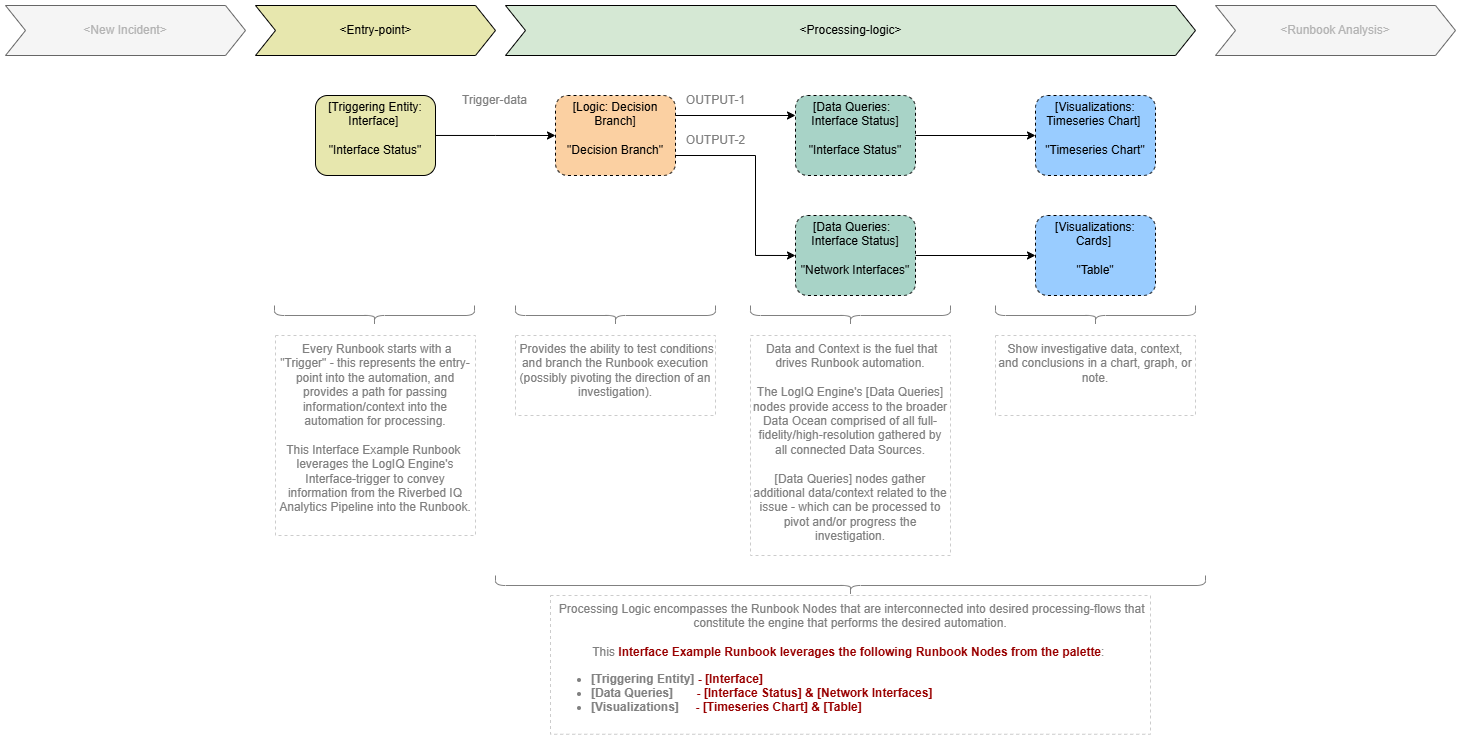
The following diagram illustrates the high-level structure of the example Interface Incident Runbook:
When a new Incident is created, an Incident Runbook automatically executes. Which Runbook that executes depends on the type of Incident. When the Runbook completes execution, Riverbed IQ Ops captures its output![]() A document containing data sets generated by the execution of a runbook, including output of queries and reports from point products, as well as output of analysis or other runbook nodes. in the Runbook analysis section of the associated Incident.
A document containing data sets generated by the execution of a runbook, including output of queries and reports from point products, as well as output of analysis or other runbook nodes. in the Runbook analysis section of the associated Incident.
The basic structure of a Runbook consists of:
-
An Entry-point (i.e. Triggering
 A set of one or more indicators that have been correlated based on certain relationships, such as time, metric type, application affected, location, or network device. Entity Things deployed in the customer environment that are needed to run the business, such as applications, devices, interfaces, and locations. node Individual components that make up a runbook automation, each performing a specific function such as data queries, transformations, logic, integrations, or visualizations.).
 -
Processing Logic
A runbook node category that adds conditions to branch the runbook, enabling conditional execution paths based on data and context. (some combination of interconnected Runbook nodes Individual components that make up a runbook automation, each performing a specific function such as data queries, transformations, logic, integrations, or visualizations. - e.g., Data Queries, Logic A runbook node category that adds conditions to branch the runbook, enabling conditional execution paths based on data and context., Visualizations A runbook node category that shows data in a chart, graph, table, or note, providing visual representation of analysis results in runbook output., etc.).
For the Interface Incident Runbook illustrated in the diagram, the following subset of Runbook Nodes were selected from the Runbook Editor palette and interconnected into the desired logic-graph:
-
Triggering Entity: Interface
-
Data Queries: Interface Status
-
Visualizations: Timeseries Chart
-
Visualizations: Cards
The following list provides a more detailed description of the Runbook:
-
Runbook Entry-point every Runbook automation starts with a Triggering Entity (aka trigger) that:
-
Represents the entry-point into the automation.
-
Provides a pathway for passing information/context into the automation for processing.
Note: Since this example describes an Interface-based Incident, the example Runbook starts with the Triggering Entity: Interface node (aka Interface Status trigger-node) that provides the initial data/context that can be processed by the automation, i.e. Triggering Interface information (e.g. Interface Name, Interface Type) Triggering Interface-metric (e.g. Interface Status, In/Out Utilization, ...) -
-
Runbook Processing-logic the initial contextual information about the Incident is passed into the automation through the trigger-node. Then, additional Runbook nodes are interconnected to process provided data/context and gather/process additional data/context. In this case, the automation logic is as follows:
-
After entry, executes the Logic: Decision Branch (aka Decision Branch) to perform a check to determine pivot between different paths of execution, e.g.
-
OUTPUT-1 / Path-1 for further investigation of Metric: Interface Status related incidents:
-
Executes Data Queries: Interface Status (aka Interface Status) to gather more data/context related to the Interface that created the Incident and triggered Runbook execution.
-
Then employs Visualizations: Timeseries Chart to graph a timeseries representation of the Interface’s Metric: Interface Status.
-
-
OUTPUT-2 / Path-2 for further investigation of Metric: In Packet Error Rate related incidents.
-
Executes Data Queries: Network Interfaces (aka Network Interfaces) to gather more data/context related to the Interface that created the Incident and triggered Runbook execution.
-
Employs Visualizations: Table to render a table of the Interface’s Metric: In Packets and Metric: Out packets summary data.
-
-
-