Ingest & Analytics: Indicators
Ingest & Analytics is the part of the pipeline that models key measurements![]() A measurement or data point that is monitored and analyzed to detect anomalies and generate incidents. from your data sources
A measurement or data point that is monitored and analyzed to detect anomalies and generate incidents. from your data sources![]() A product in your network that forwards data to the system. This data can be streaming data used to detect anomalies and generate incidents, or data that can be fetched on demand when runbooks are executed. and decides when behavior is anomalous
A product in your network that forwards data to the system. This data can be streaming data used to detect anomalies and generate incidents, or data that can be fetched on demand when runbooks are executed. and decides when behavior is anomalous![]() An unexpected event or measurement that does not match the expected model.. For each measurement it uses either a simple model (e.g. a static threshold) or a learned model (e.g. a time-series baseline). When an observed value deviates from that model in a significant way, the platform classifies it as an anomaly and generates an indicator
An unexpected event or measurement that does not match the expected model.. For each measurement it uses either a simple model (e.g. a static threshold) or a learned model (e.g. a time-series baseline). When an observed value deviates from that model in a significant way, the platform classifies it as an anomaly and generates an indicator![]() An observed change in a specific metric stream that is recognized as being outside of an expected model. Indicators are correlated into triggers, and one or more triggers are grouped into incidents.. Each indicator carries context (entity, metric, expected vs. observed value, and similar) that the rest of the pipeline uses when correlating indicators into detections
An observed change in a specific metric stream that is recognized as being outside of an expected model. Indicators are correlated into triggers, and one or more triggers are grouped into incidents.. Each indicator carries context (entity, metric, expected vs. observed value, and similar) that the rest of the pipeline uses when correlating indicators into detections![]() One or more indicators that are correlated and may act as a trigger for incident creation or runbook execution. and when running runbooks
One or more indicators that are correlated and may act as a trigger for incident creation or runbook execution. and when running runbooks![]() An automated workflow that executes a series of steps or tasks in response to a triggered event, such as the detection of anomalous behavior generating an incident, a lifecycle event, or a manually executed runbook..
An automated workflow that executes a series of steps or tasks in response to a triggered event, such as the detection of anomalous behavior generating an incident, a lifecycle event, or a manually executed runbook..
Indicators matter because they are the building blocks of incidents![]() A collection of one or more related triggers. Relationships that cause triggers to be combined into incidents include application, location, operating system, or a trigger by itself.. Correlation groups indicators into detections. Each detection becomes an incident and determines which runbook runs. What you configure for indicator generation controls what the platform surfaces and how much noise you get. Understanding how the platform produces indicators helps you interpret incident details and tune configuration so the right anomalies become incidents.
A collection of one or more related triggers. Relationships that cause triggers to be combined into incidents include application, location, operating system, or a trigger by itself.. Correlation groups indicators into detections. Each detection becomes an incident and determines which runbook runs. What you configure for indicator generation controls what the platform surfaces and how much noise you get. Understanding how the platform produces indicators helps you interpret incident details and tune configuration so the right anomalies become incidents.
For application activities at a location, Activity Response Time indicators appear when the dynamic-threshold policy in the Application activities section of Analytics & Threshold Configuration flags an anomaly (see Analytics configuration sections). Those indicators participate in correlation like other entity types and can create incidents on the application-activity-location object. The incident automation uses the Application/Activity/Location triggering entity; assign and edit that runbook from Automation Management.
How to get there
-
To configure when and how indicators are created: Open the Analytics & Threshold Configuration page.
-
To see indicators in use: Indicators are not listed on a separate page. They appear on every incident. Open the Incidents page, then open an incident. The Incident Details page shows the Primary Indicator and any Correlated Indicators in the Incident Sources section, with entity, metric, expected range, observed value, and deviation. Runbook analysis on the same page uses the detection (trigger) built from those indicators.
How to use indicators
-
Configure: Use Analytics & Threshold Configuration to choose which measurements produce indicators and under what rules (e.g. threshold value, baseline sensitivity, N of M). That choice determines which anomalies become indicators and therefore which incidents can be created. The page is organized by entity type (network devices, interfaces, applications, application activities). For the list of metrics and sections, see Analytics configuration sections. For an overview of the algorithms and how to work with them, see Analytics algorithms overview.
-
Consume: You do not manage indicators on a dedicated screen. You see them on each incident. Use the Primary Indicator and Correlated Indicators on the Incident Details page to understand what the platform flagged and why. The primary indicator drives the incident description and which runbook runs. Correlated indicators add context. To find incidents by entity or metric, use the Filters pane on the Incidents page or global search. Results include incidents where that object appears as an indicator.
Anomaly detection algorithms
Riverbed IQ Ops supports the following anomaly detection algorithms:
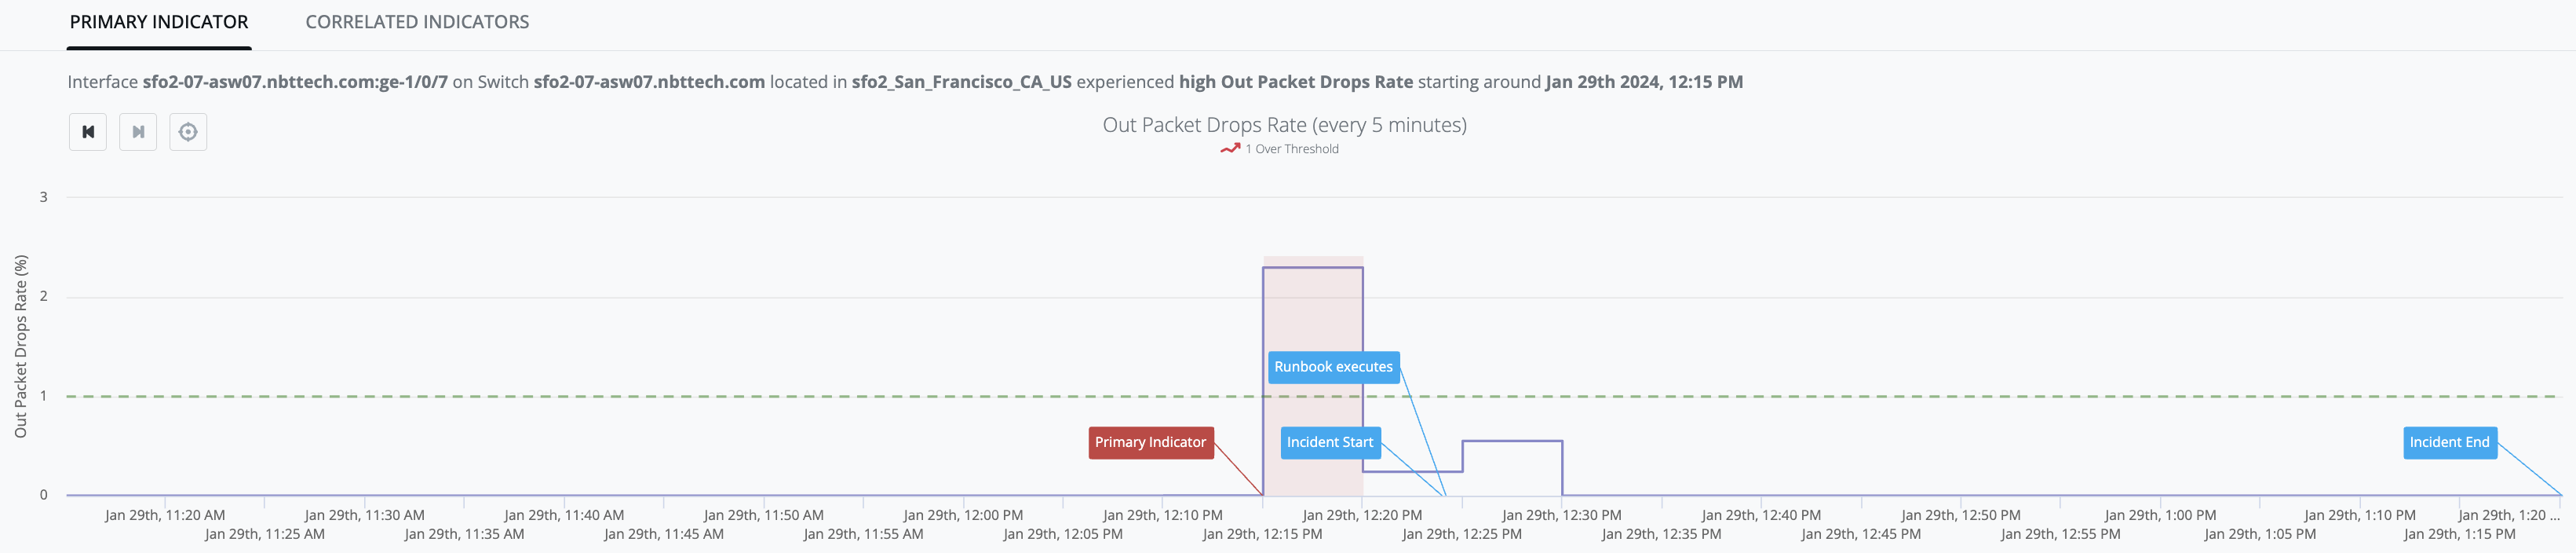
Static threshold (ThresholdDetector)
-
IQ ThresholdDetector models configured simple thresholds. It can be configured to model "too-high" thresholds and/or "too-low" thresholds.
-
When configured to model "too-high" thresholds: any [observed-value] that exceeds the model's [high-threshold] is classified as an anomaly.
-
When configured to model "too-low" thresholds: any [observed-value] that falls below the model's [low-threshold] is classified as an anomaly.
-
-
Example Graph: [out_packet_drops_rate] observed values stay below the [high-threshold] up until Jan-29th, 12:15PM when [observed-value: 2.3%] exceeds the [high-threshold: 1%] and generates an Indicator (red-zone):
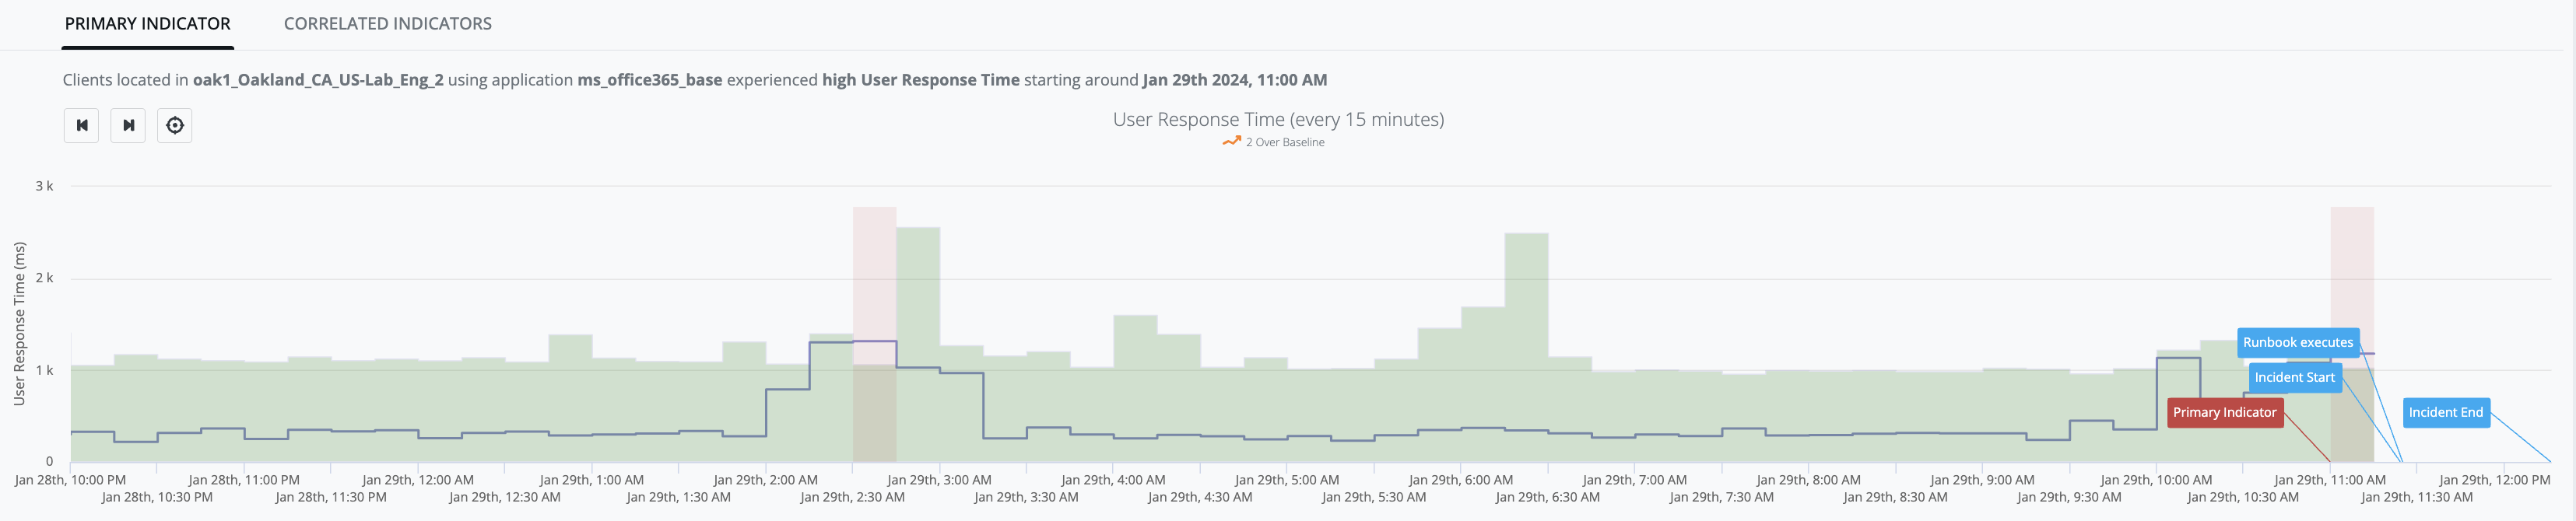
Time-series baseline (BaselineDetector)
-
IQ BaselineDetector model leverages Season/Trend/Level (STL) history/data to predict an [expected-range] of values (i.e. "green-river") within which it expects the next [observed-value] to lie. The initial model is built using two days of data (i.e., models daily-seasonality), and is replaced by a final model after two weeks of data (i.e. models weekly-seasonality). The model is updated with each new [observed-value].
-
Any [observed-value] that falls above the predicted [expected-range] will be classified as an anomaly.
-
Any [observed-value] that falls below the predicted [expected-range] will be classified as an anomaly.
-
-
Example Graph: [user_response_time] observed-values stay within the green river up until Jan-29th, 11:00AM when [observed-value: 1.18s] exceeds the [expected-range: 0ms - 1.02s] and generates an Indicator (red-zone):
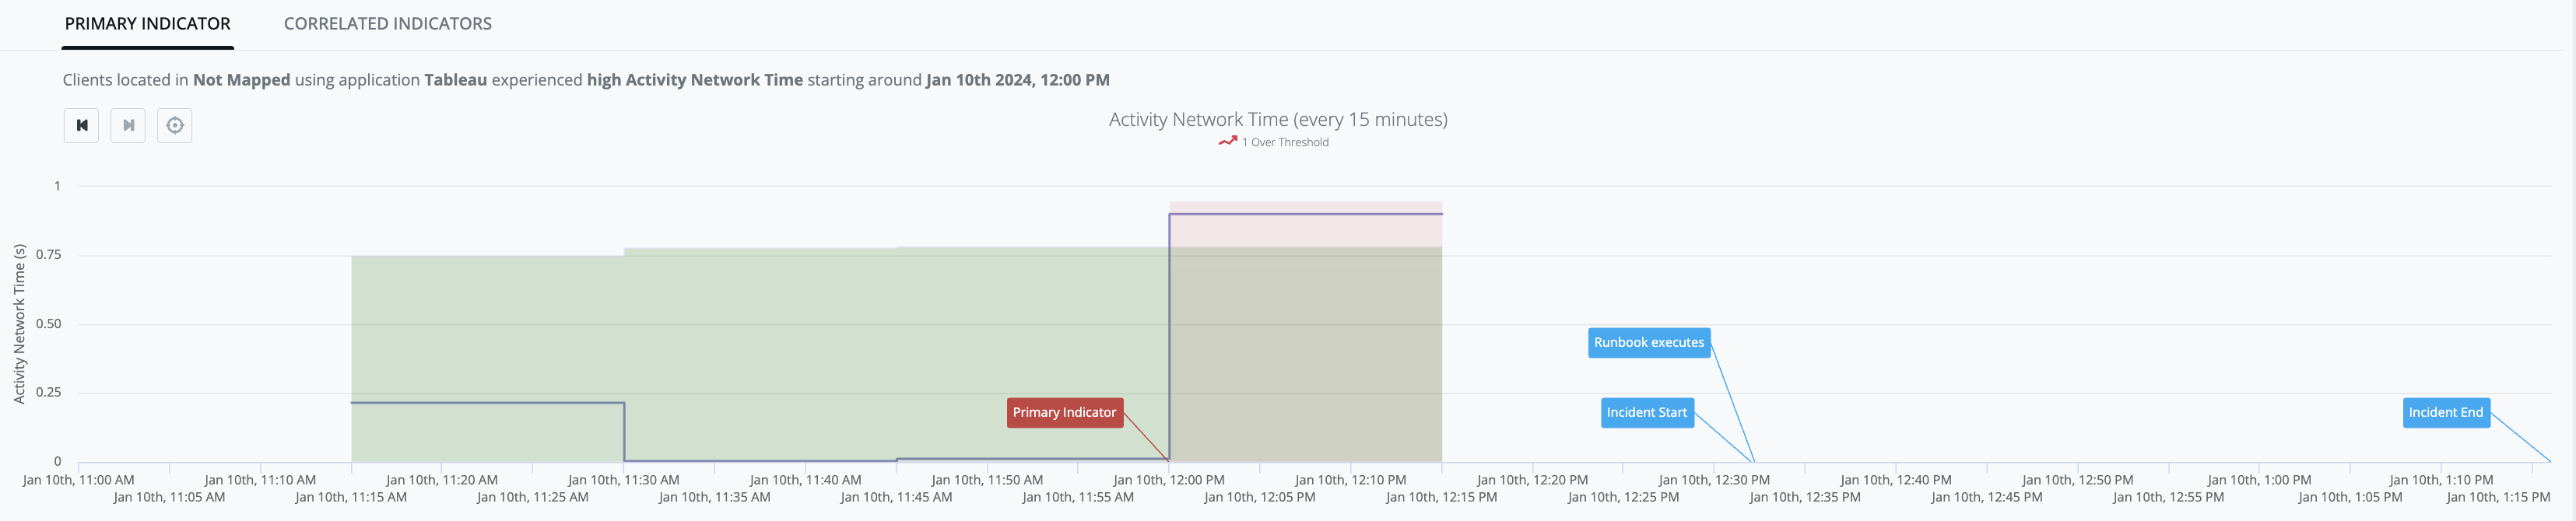
Dynamic threshold (DynamicThreshold)
-
DynamicThresholdDetector models a target dataset using an exponential distribution that is "fitted" to the target dataset in order to profile the pattern. This profile is then used to calculate the [dynamic-threshold-value] for the dataset when a new [observed-value] arrives. The model is updated with each new [observed-value].
-
Any [observed-value] that falls above the calculated [dynamic-threshold-value] will be considered anomalous.
-
-
Example Graph: [activity_network_time] observed values stay within the green-river up until Jan-10th, 12:00PM when [observed-value: 0.90s] exceeds the [dynamic-threshold-value: 0.78s] and generates an Indicator (red-zone):
Bounded dynamic threshold (BoundedDynamicThreshold)
-
BoundedDynamicThresholdDetector models a target dataset using a statistical machine learning algorithm that is fitted to the target dataset to profile the pattern. This algorithm takes advantage of the fact that the target dataset values must be bounded between 0% and 100%. This profile is then used to calculate the [bounded-dynamic-threshold-value] for the dataset when a new [observed-value] arrives. The model is updated with each new [observed-value].
-
Any [observed-value] that increases in an unusual way and exceeds the calculated [bounded-dynamic-threshold-value] is considered anomalous and the platform generates an IQ Ops incident.
State change (ChangeDetector)
-
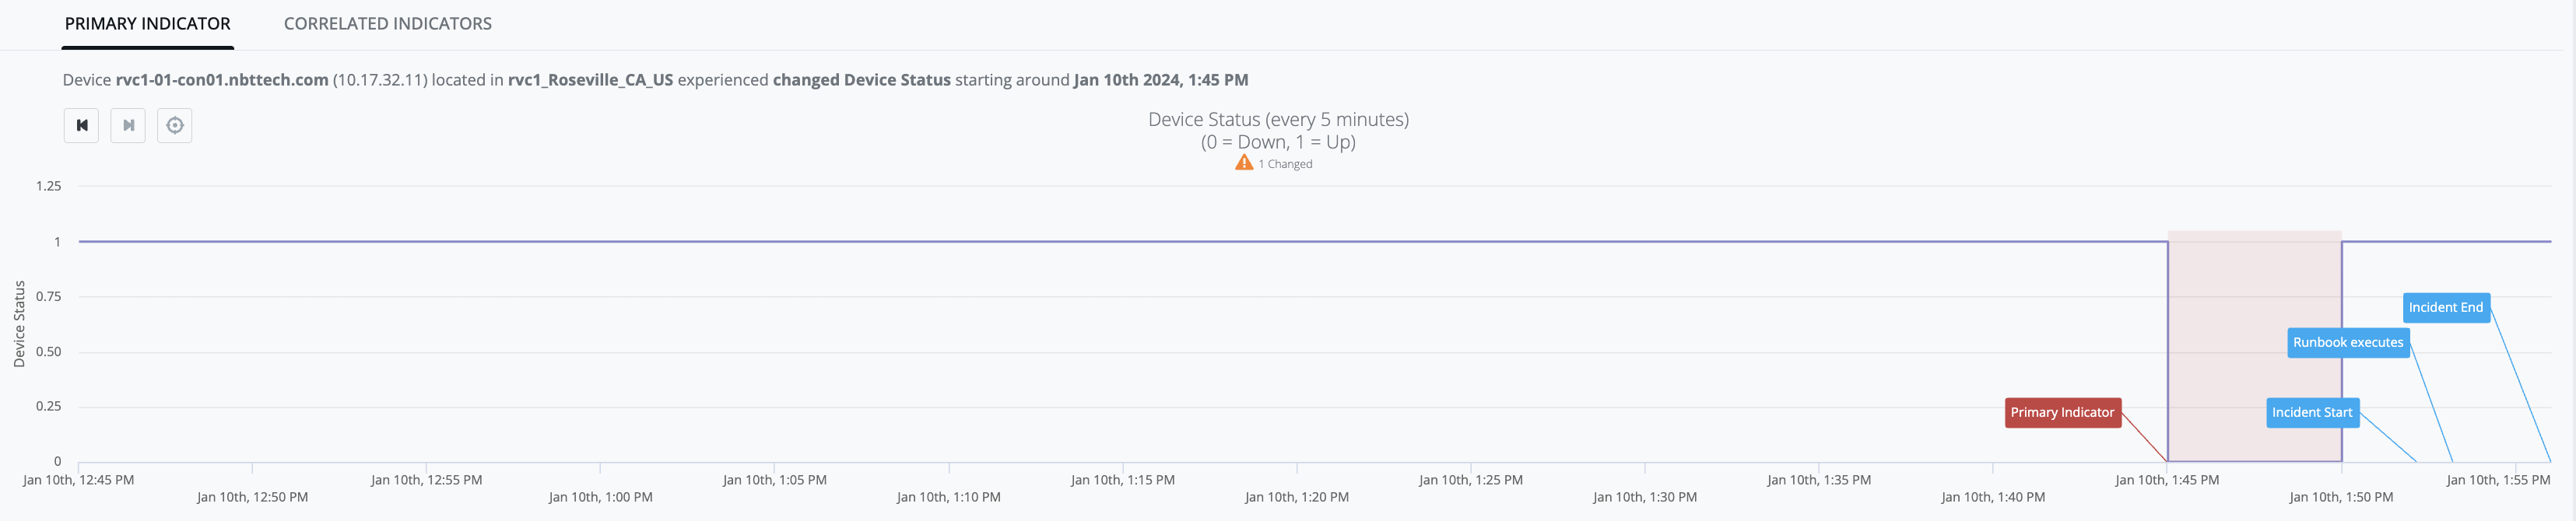
IQ ChangeDetector model does not make any dynamic predictions. Instead, it models a configured [expected-value], and any state change in [observed-value] that does not match [expected-value] is treated as an indicator of bad behavior.
-
Example Graph: [device-status] observed-value is consistently up ([observed-value: 1]) up until Jan-10th, 1:45PM:
-
then [observed-value: 0] occurs (i.e. state-change from prior [observed-value: 1]), and
-
the result of that state-change is that [device-status] no longer matches [expected-value: 1] and generates an Indicator (red-zone):
-
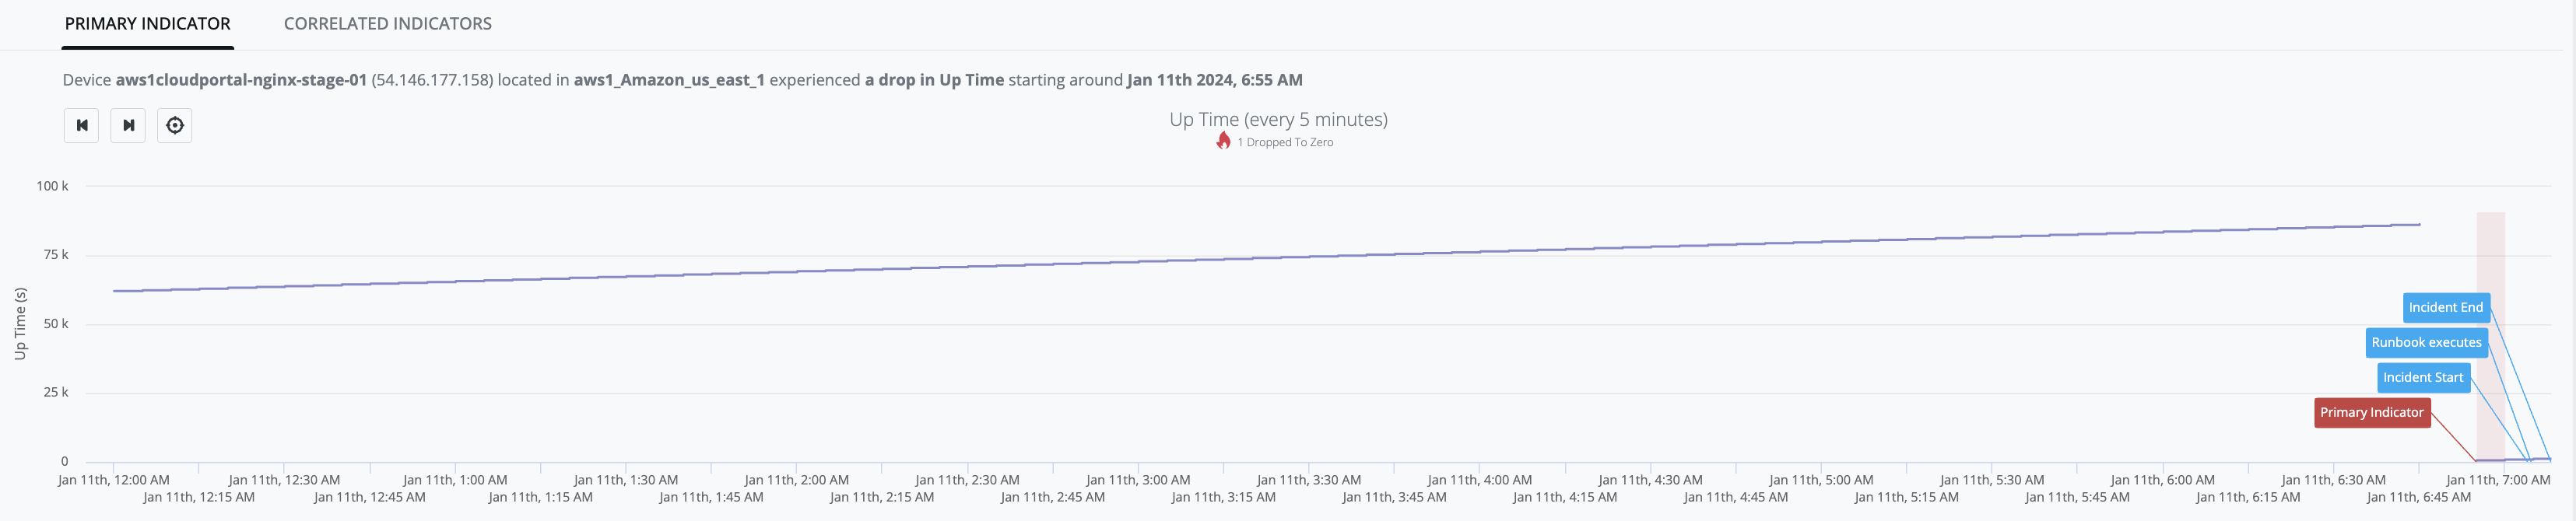
Continuously increasing (AlwaysIncreasingDetector)
-
AlwaysIncreasingDetector models a system where the dataset has ever-increasing values during normal operation.
-
Any [observed-value] that is less than [previous-value] is treated as an indicator of bad behavior.
-
-
Example Graph: [device_up_time] observed-values continue to increase up until Jan-11th, 6:45AM when [observed-value: 23h 59m 16s] - then there is absence of samples for 10-minute period, and when the next sample arrives [observed-value: 9m 10s], is determined to be less than the last known measurement (i.e. 23h 59m 16s) and an indicator is generated (red-zone):