Interfaces
The Interface![]() An entity type representing network interfaces on devices that are monitored for performance metrics and anomalies. Explorer page displays interfaces ingested by Riverbed IQ Ops. This page allows you to search all interfaces known to Riverbed IQ Ops and tag them using custom properties. You can also forecast Interface Utilization using Predictive AI
An entity type representing network interfaces on devices that are monitored for performance metrics and anomalies. Explorer page displays interfaces ingested by Riverbed IQ Ops. This page allows you to search all interfaces known to Riverbed IQ Ops and tag them using custom properties. You can also forecast Interface Utilization using Predictive AI![]() Artificial Intelligence. Technology that applies intelligence and automation to observe environments, detect anomalous behavior, and execute automated investigations.. The page lists all interfaces known to IQ Ops.
Artificial Intelligence. Technology that applies intelligence and automation to observe environments, detect anomalous behavior, and execute automated investigations.. The page lists all interfaces known to IQ Ops.
-
Navigate to the Explorer Interfaces Page:
-
Click the Launchpad button ⁝⁝⁝.
-
Click IQ Ops > Management.
-
In the Management page, click the Hamburger Icon, then click Explorer - Interfaces.
-
Interfaces Page
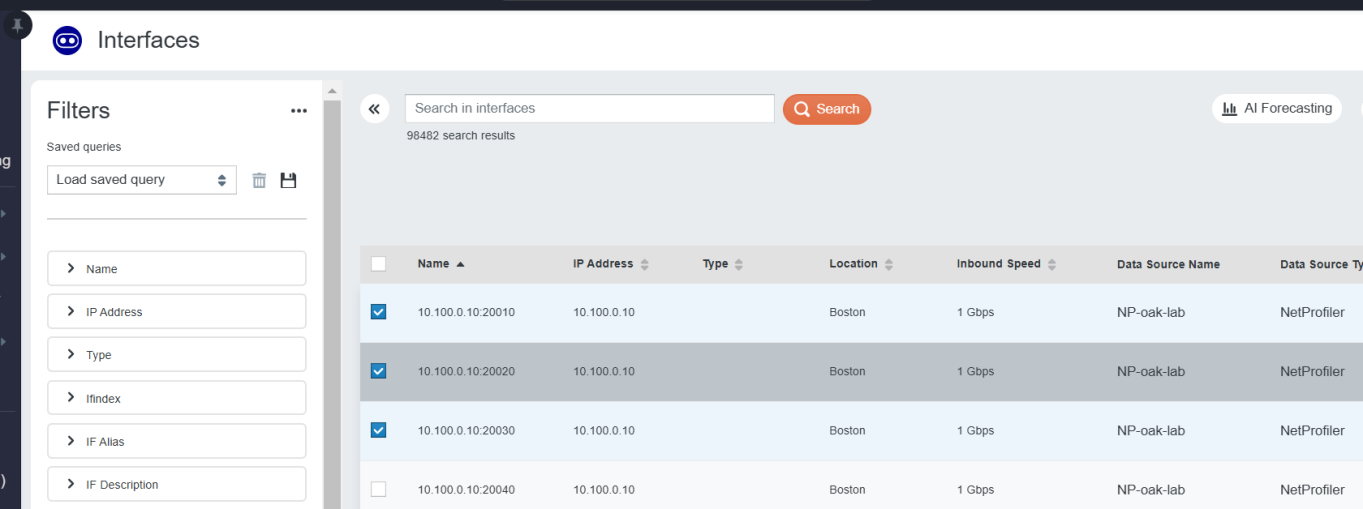
The Interfaces page shows these columns for each interface:
-
Name: The name of the interface.
-
IP Address: The IP address of the interface.
-
ifindex: The Ifindex of the interface.
-
IF Alias: The IF Alias of the interface.
-
IF Description: The IF Description of the interface.
-
Type: The type of interface.
-
Location: The physical location
 An entity type representing physical or logical locations in the customer environment where entities are deployed and monitored. of the interface.
 -
Inbound Speed: The inbound speed of this interface.
-
Outbound Speed: The outbound speed of this interface.
-
Custom Properties: The list of custom properties assigned to the interface.
-
Data Source Name: The name of the data sources
A product in your network that forwards data to the system. This data can be streaming data used to detect anomalies and generate incidents, or data that can be fetched on demand when runbooks are executed. that reported the interface.
You can show or hide columns by clicking on the column chooser button. The column chooser button is located in the upper right corner of the table. Clicking on the column chooser will launch the column chooser dialog.
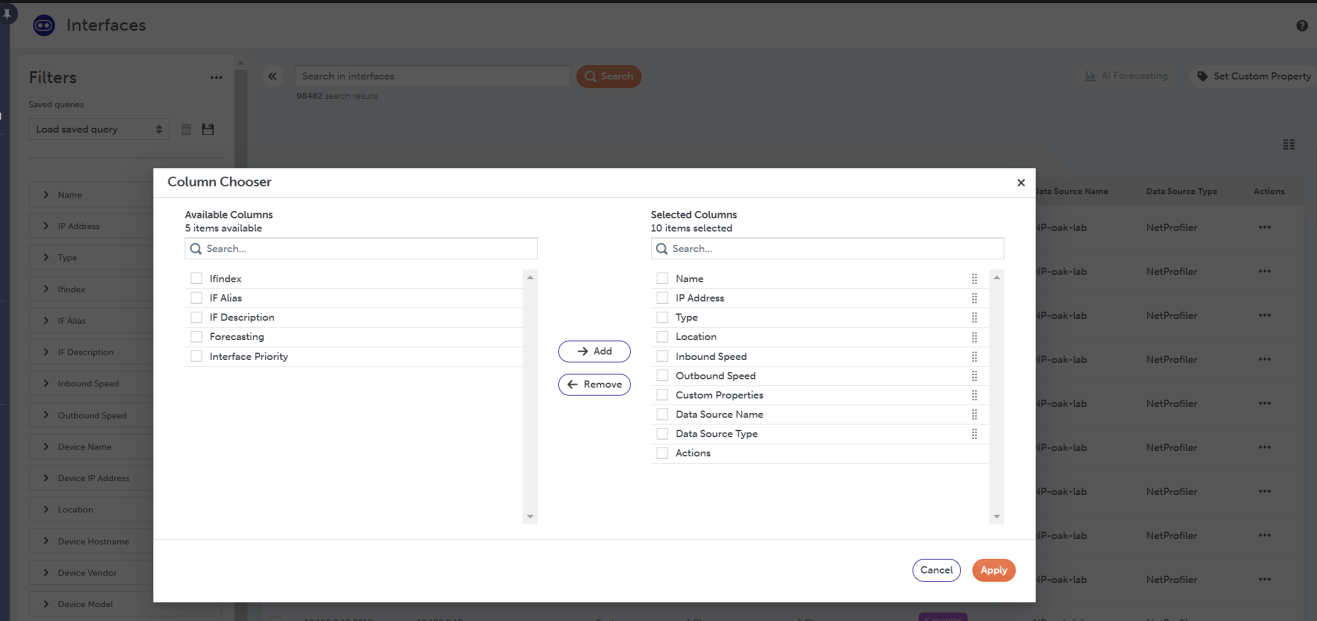
To add columns to the table, select columns in the list of Available Columns and click the Add button. They will move into the list of Selected Columns. To remove columns from the table, select columns in the list of Selected Columns and click the Remove button and they will move back into the list of Available Columns.
Searching For Interfaces
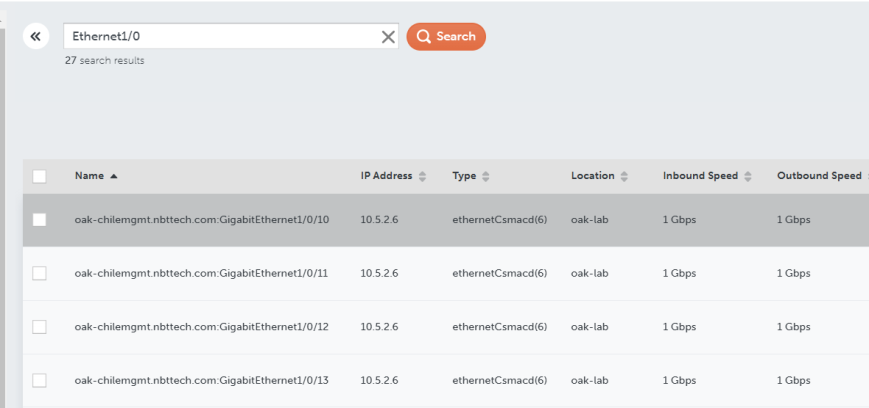
You can search for Interfaces using the Filter section or by doing a text search. To do a text search, enter the search team in the search box and click Search. Notice that the number of search results are always displayed below the search box.
There are a large number of interface properties that can be used for filtering the interfaces. To add a filter, expand the filter section and select the items you want to see in the search results and click Apply Filters.
![]()
To add and remove filter facets, click on the ... next to the Filters label and select Customize list. This action launches the Facets Chooser .
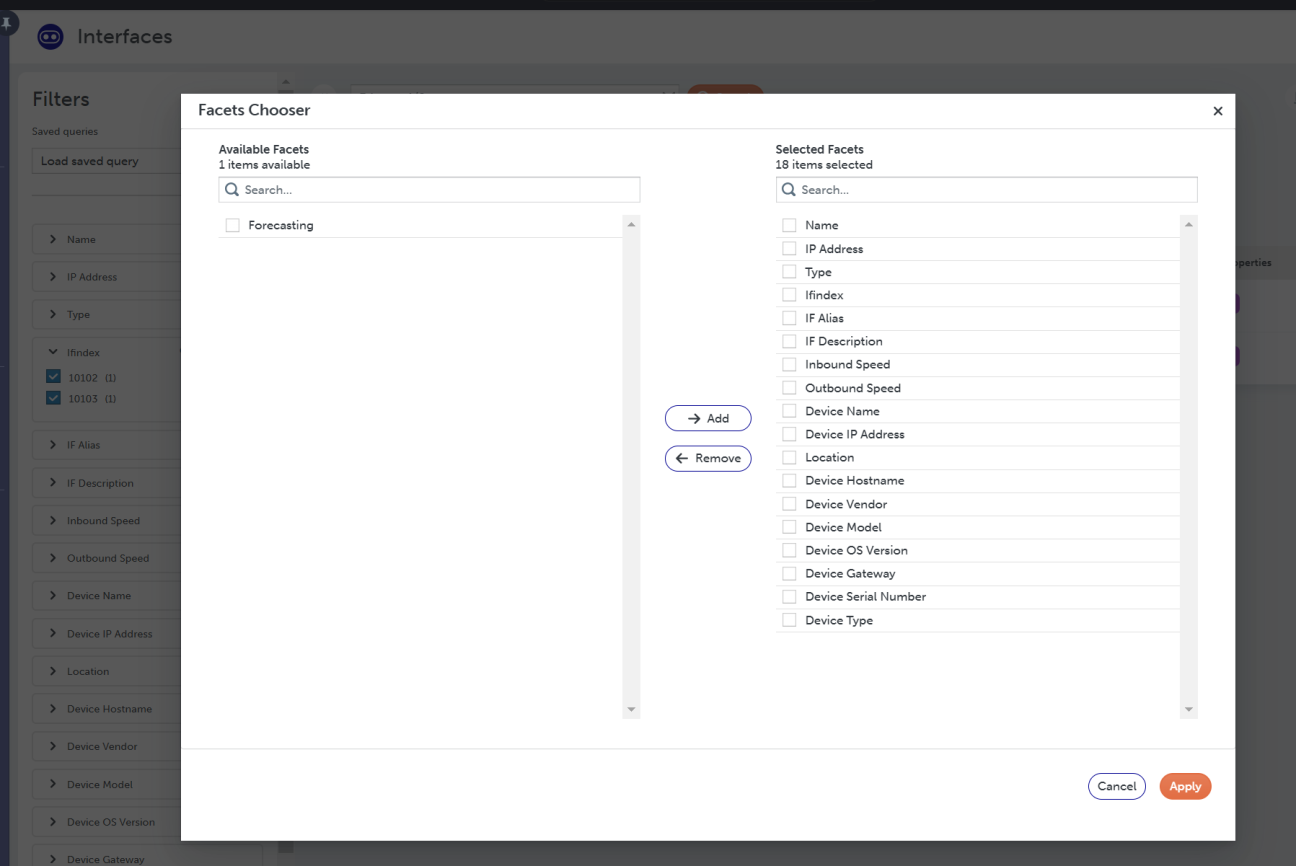
To add facets to the filter bar, select facets in the list of Available Facets and click the Add button and they will move into the list of Selected Facets. To remove facets from the filter bar, select facets in the list of Selected Facets and click the Remove button. The facet will move back into the list of Available Facets.
Setting Custom Properties
You can assign Custom Properties to an interface. You can use these custom properties as filters when you search for interfaces. The
custom properties can be displayed in the runbook![]() An automated workflow that executes a series of steps or tasks in response to a triggered event, such as the detection of anomalous behavior generating an incident, a lifecycle event, or a manually executed runbook. tables. To set a custom property on an interface, click the Set Custom Property button
in the toolbar.
An automated workflow that executes a series of steps or tasks in response to a triggered event, such as the detection of anomalous behavior generating an incident, a lifecycle event, or a manually executed runbook. tables. To set a custom property on an interface, click the Set Custom Property button
in the toolbar.
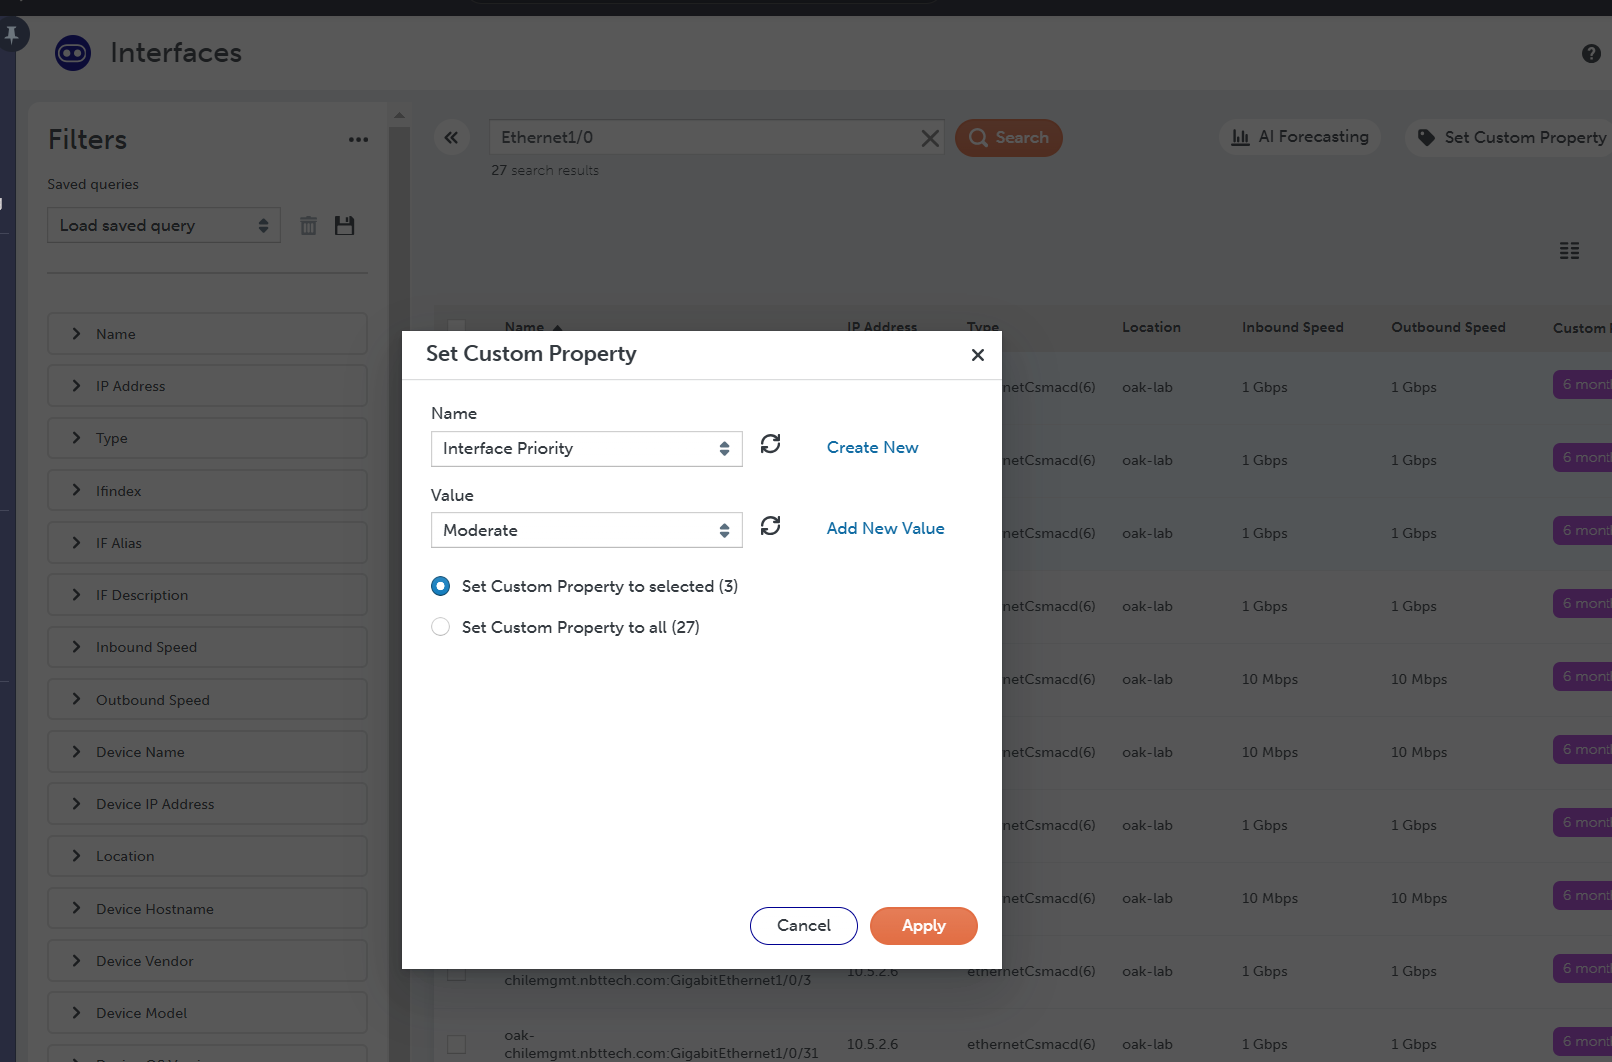
This action launches the Set Custom Property dialog. In the Name dropdown, select the custom property you want to use to tag the interfaces. In the Value dropdown, select the value of the custom property. You can choose to apply the custom property to only the interfaces currently selected in the table or you can apply the custom property to all the interfaces in the current search results using the radio buttons. When you are done, click Apply.
Predictive AI
The Predictive AI - Forecast feature allows a user to select up to ten interfaces and, through the use of Machine Learning algorithms, predict when those interfaces will have utilizations above a customizable threshold. This feature is ideal for use in capacity planning. To use the Predictive AI feature:
-
Navigate to the Explorer > Interfaces page.
-
Select up to ten interfaces to run the forecast.
-
Click on “AI Forecasting” to bring up the forecasting dialog.
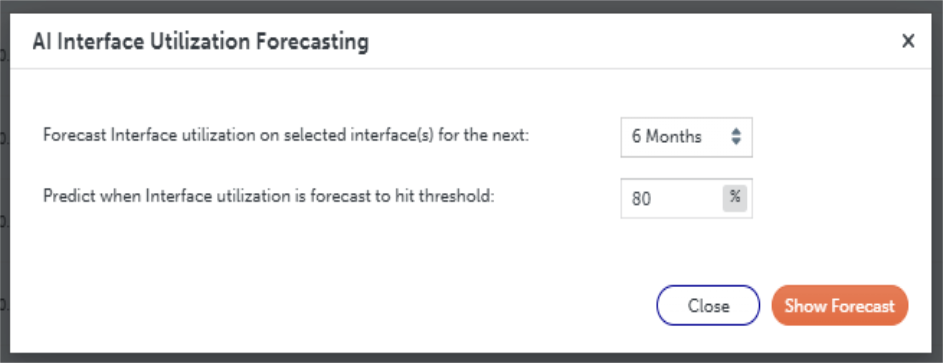
Here, the user can choose how far into the future to run the prediction on all selected interfaces (one, three or six months), as well as have IQ Ops highlight when the predicted utilization will cross the given threshold. The threshold must be a value between 0 and 100, inclusive.
The predicted value can be thought of as an average, or normal value, based on what the algorithm learns by analyzing the interface.
-
Click “Show Forecast” to submit a forecast request.
The AI Engine examines up to a month’s worth of historical data for each interface, for both in- and out-utilization. It learns each interface’s traffic patterns and then predicts what that traffic will look like one, three, or six, months into the future.
The learning and prediction are calculated on demand. It may take several seconds to complete the results. Once they are, the selected interfaces are summarized:
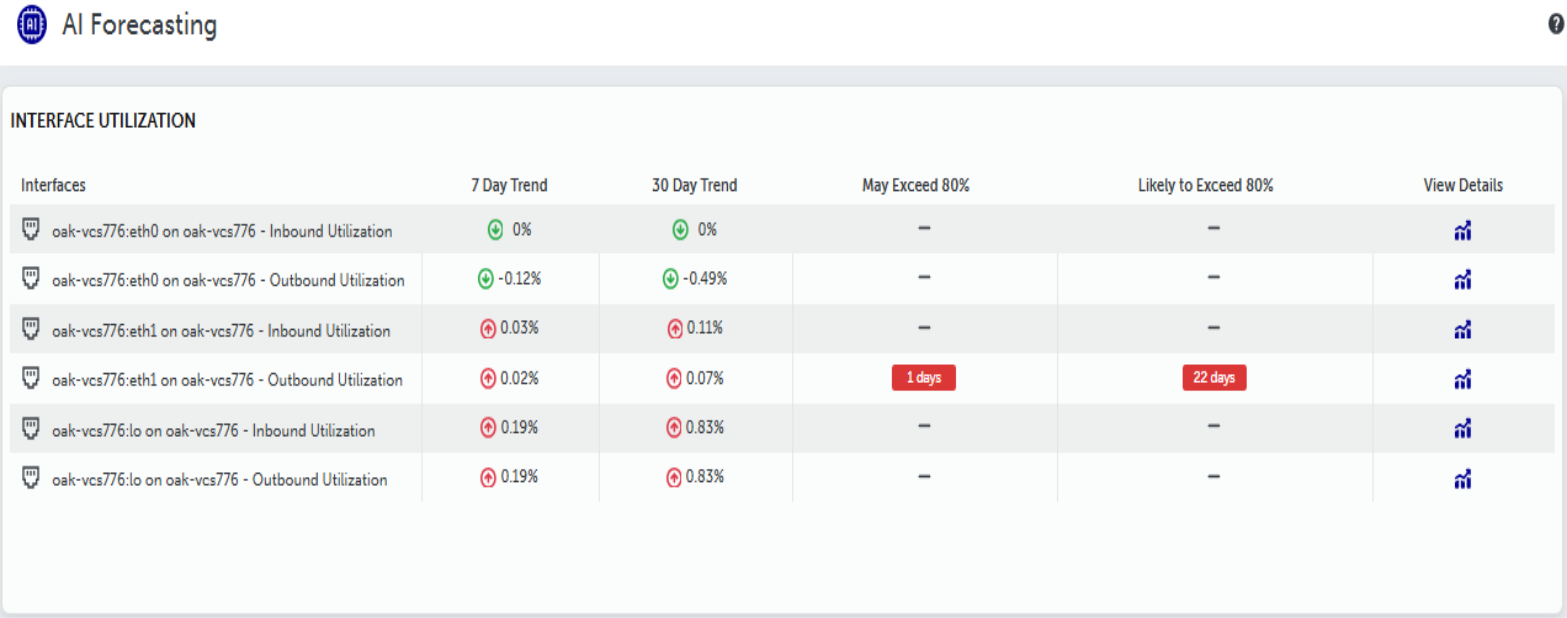
Here, the in- and out-utilizations are summarized for each selected interface, as well as the predicted percentage change (up or down) for the next seven days and 30 days. If the expected high value of the prediction range exceeds the threshold, the number of days until that happens is shown in the May Exceed column. If the expected value of the prediction exceeds the threshold, the number of days until that happens is shown in the Likely to Exceed column.
It is possible that new or lightly used interfaces do not have enough data to a accurately predict their utilizations in the future. If this occurs, a red icon will appear over “View Details”. You can hover over the icon for more information.
-
Click on the blue icon in “View Details” to render the historical data used to train the algorithm and the predicted values.
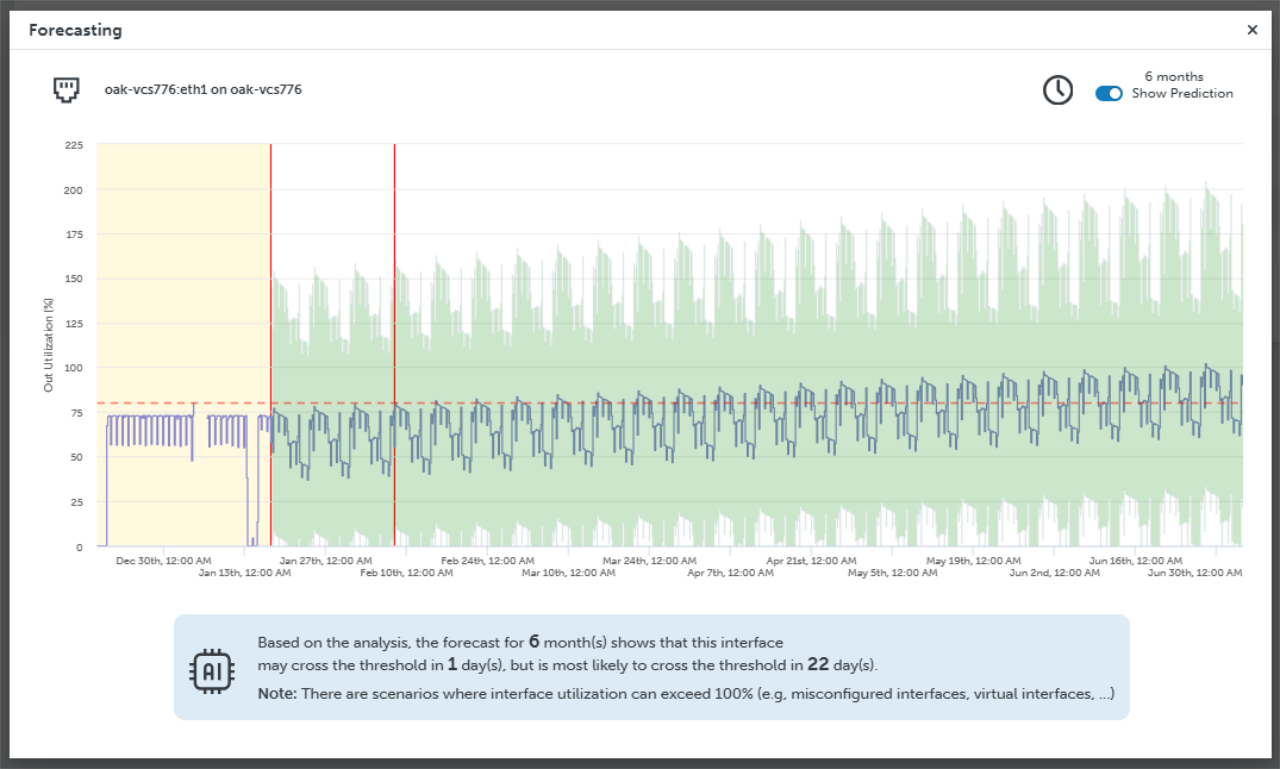
The yellow region shows historical data. The green region shows the predictions, with the expected normal range, based on the natural variability of the data.
Closing the summary table deletes the forecast data. You can regenerate the data by entering the desired time range and thresholds. Then click “Show Forecast”.