Test Profiles Page
The Test Profiles page lists every test profile A reusable Core Assurance definition of a synthetic test. A test profile sets what to test, what counts as a passing run, when the test runs, which test endpoints run it, and what to do when enough endpoints fail. in your tenant and shows the state of each profile. From the Test Profiles page, you also open the New Test Profile and Edit Test Profile pages, which share the six tabs described in Test profile tabs.
Navigate to the Test Profiles page:
-
Click Apps in the left menu.
-
Click Apps Library.
-
Click the Core Assurance card.
-
On the Test Profiles card, click Show Test Profiles.
Summary cards
The top of the page shows four summary cards. Click a card to filter the list to the profiles the card counts.
-
Total Test Profiles: All test profiles in your tenant.
-
Pending Sync: Profiles whose configuration has not yet been confirmed by every assigned endpoint.
-
Alerting: Profiles whose trigger condition is met and that have an open observation
A record of a condition in your environment that needs attention. Observations appear on the Observations page and in the Observation Feed widget, and they move through lifecycle states. For example, Core Assurance creates an observation when the percentage of online endpoints that fail a test is at or above the trigger set in the test profile.. -
Dampening: Profiles in their dampening period.
Search and filters
Type in Search profiles... to find profiles by name. Use the filters to narrow the list:
-
Test Types: Show only profiles of the selected test types.
-
Sync Status: Show profiles that are In Sync, Pending Sync, or Out of Sync. See Sync statuses.
-
Test Status: Show profiles that are Active, Inactive, Alerting, or Dampening.
Applied filters appear above the list. Click Clear all to remove the applied filters.
Profile list
The list shows the following columns. Click a column heading to sort the list by the column.
-
Profile Name: The name of the test profile.
-
Test Type: The type of test the profile runs.
-
Target: The host, domain, or URL (Uniform Resource Locator
Uniform Resource Locator. The address used to access resources on the internet, such as webhook endpoints or API endpoints for runbook automation.) the test checks. -
Status: The current status of the profile. See Profile statuses.
-
# Endpoints Assigned: The number of endpoints the profile is assigned to. A Pending Sync
A sync status that means a test profile deployment is saved in the cloud, but one or more assigned endpoints have not yet applied and confirmed it. label appears beside the count until every assigned endpoint confirms the configuration. -
Last Modified: When the profile was last changed.
Click a row to open the Test Endpoints page filtered to the endpoints that run the profile. See Test Endpoints Page.
Row actions
Click the more actions button (three vertical dots) at the end of a row to open the actions menu for the profile:
-
View Test Results: Opens the Test Results page filtered to the profile. See Test Results Page.
-
View Test Failures: Opens the Test Results page filtered to the failed runs of the profile.
-
Edit profile: Opens the profile on the Edit Test Profile page.
-
Enable or Disable: Turns the profile on or off.
-
Delete: Deletes the profile after you confirm.
The edit, enable, disable, and delete actions appear only when your account has permission to change test profiles. See Edit, Disable, or Delete a Test Profile.
Test profile tabs
The New Test Profile page and the Edit Test Profile page have the same six tabs. You can move between tabs in any order. After you open a tab, the tab title shows a check mark when the tab is complete, or an error icon when the tab still has errors. Required fields are marked with an asterisk (*).
Basic Info tab
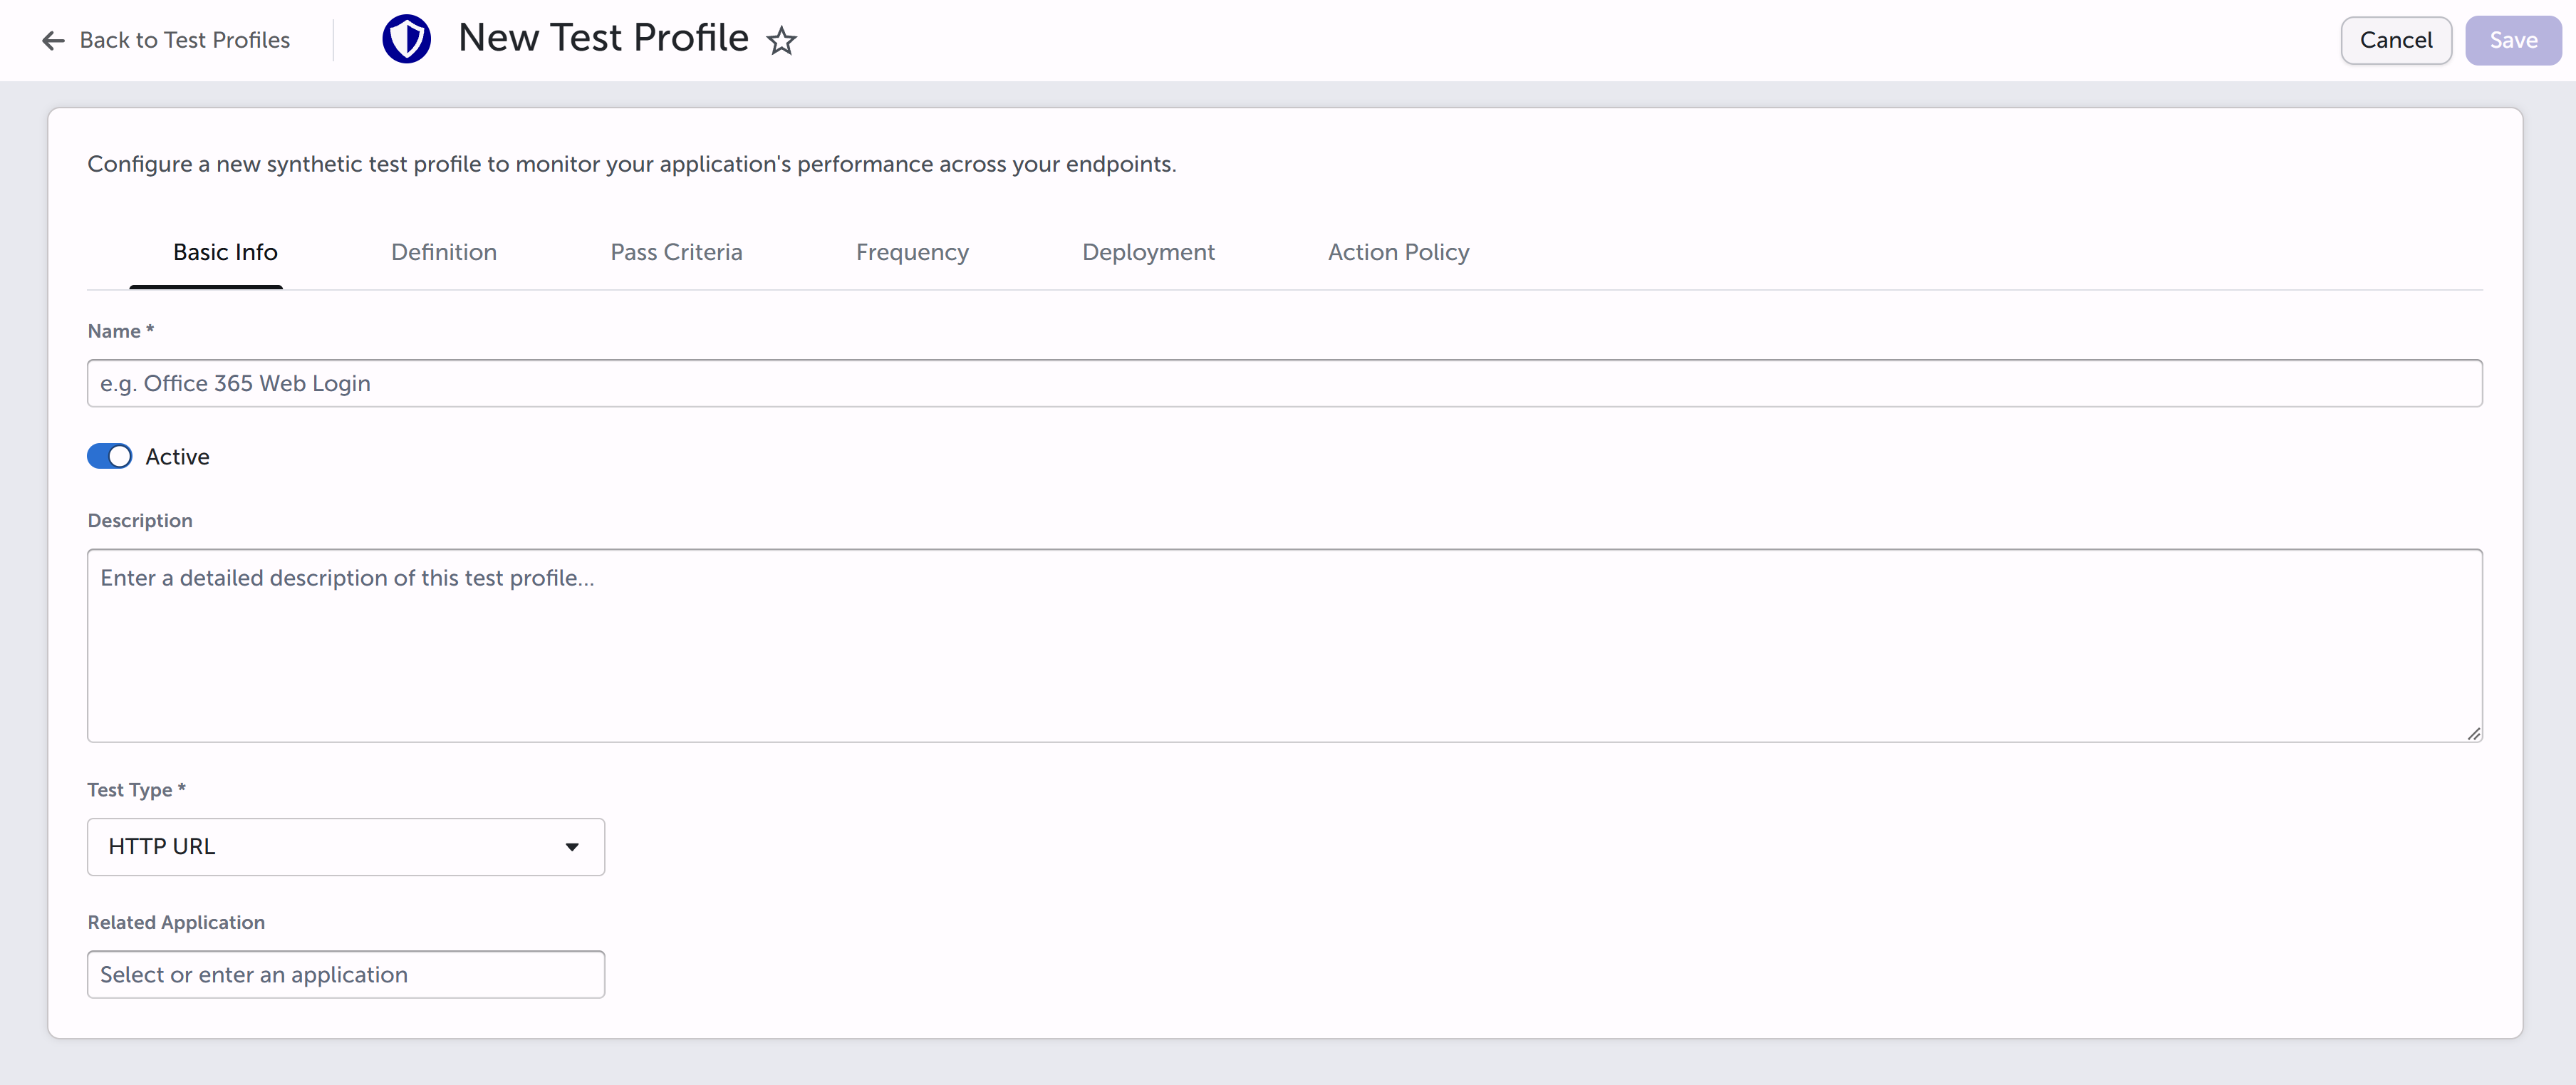
-
Name (required): A display name for the profile, for example Office 365 Web Login.
-
Active: Turn on to let the profile run. Turn off to save the profile without running the profile. The switch is on by default.
-
Description: Optional notes for other operators.
-
Test Type (required): DNS Lookup, HTTP URL, Ping, TCP Port, Traceroute TCP, or Traceroute with ICMP. The test types cover DNS (Domain Name System) lookups, HTTP (Hypertext Transfer Protocol
Hypertext Transfer Protocol. A protocol used for transmitting data over the internet, commonly used in webhook runbooks and integrations with external systems.) requests, ICMP (Internet Control Message Protocol) pings and traceroutes, and TCP (Transmission Control Protocol) connections and traceroutes. The test type decides which fields appear on the Definition and Pass Criteria tabs. The default is HTTP URL. See Core Assurance Supported Test Types. -
Related Application: An optional application
An entity type representing software applications deployed in the customer environment that are monitored for performance and anomalies. name that you use to group and filter profiles and results. Start typing to see suggestions from your network traffic data, or enter a new name.
Definition tab
The Definition tab sets what the endpoint runs: the target, such as a host name or web address, and the test settings, such as the timeout. If a test does not finish within its timeout, the run fails.
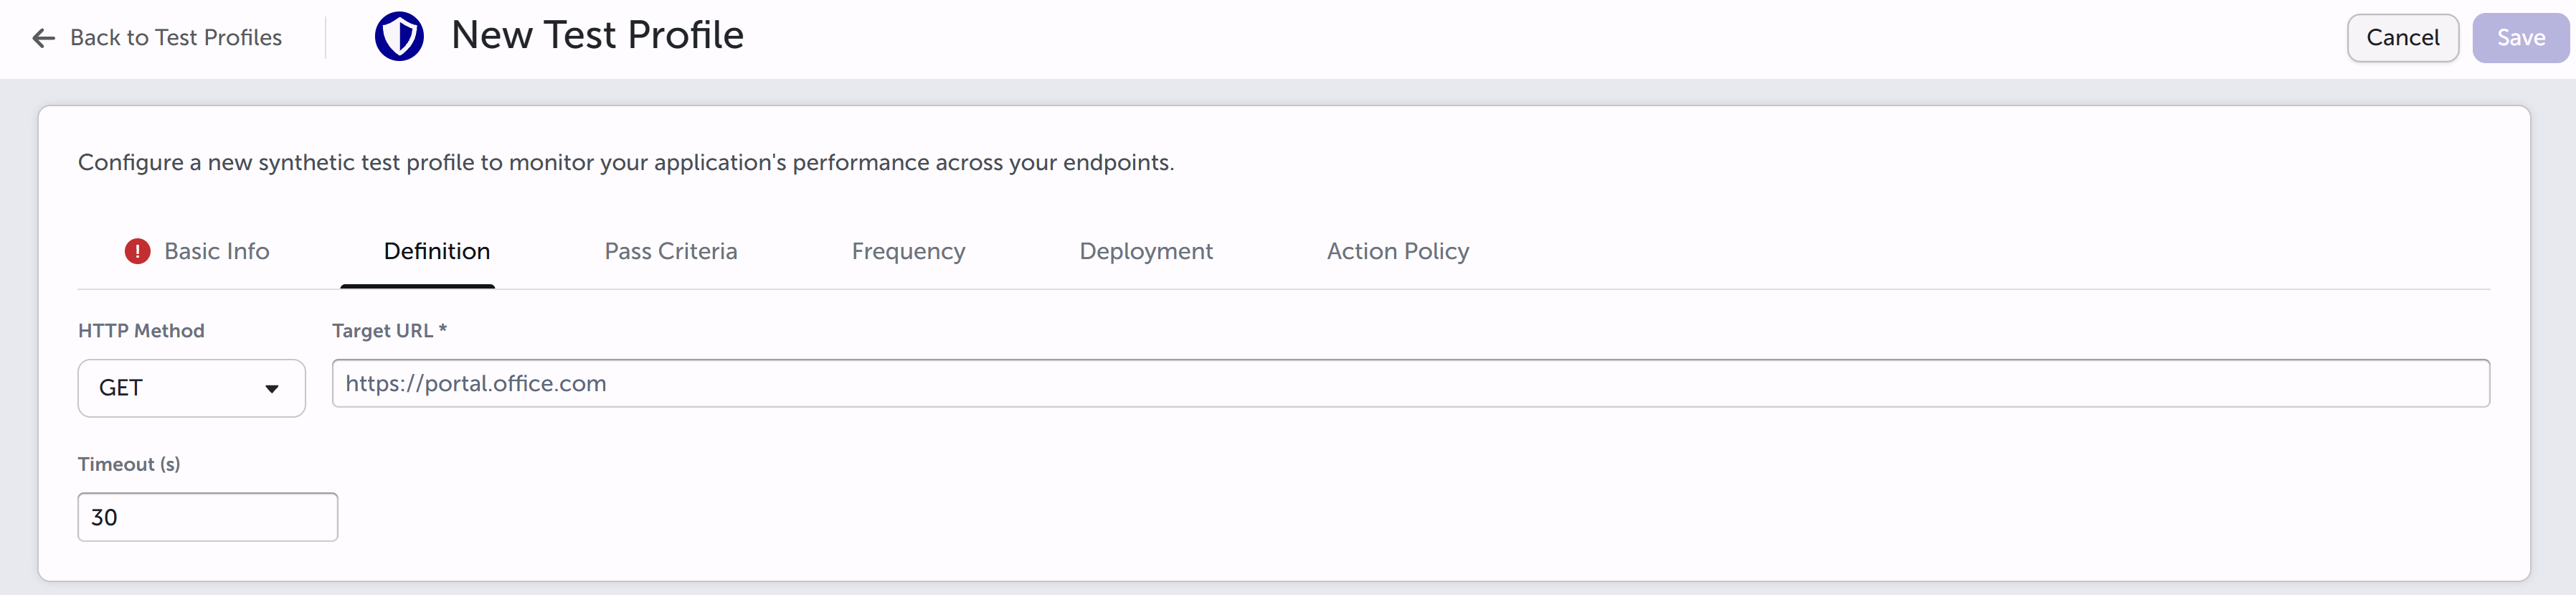
The fields depend on the test type. Each field has a default value except the target, which you must enter. For every field, its default, and examples, see the topic for your test type:
-
Traceroute Test Settings, for both Traceroute TCP and Traceroute with ICMP.
Pass Criteria tab
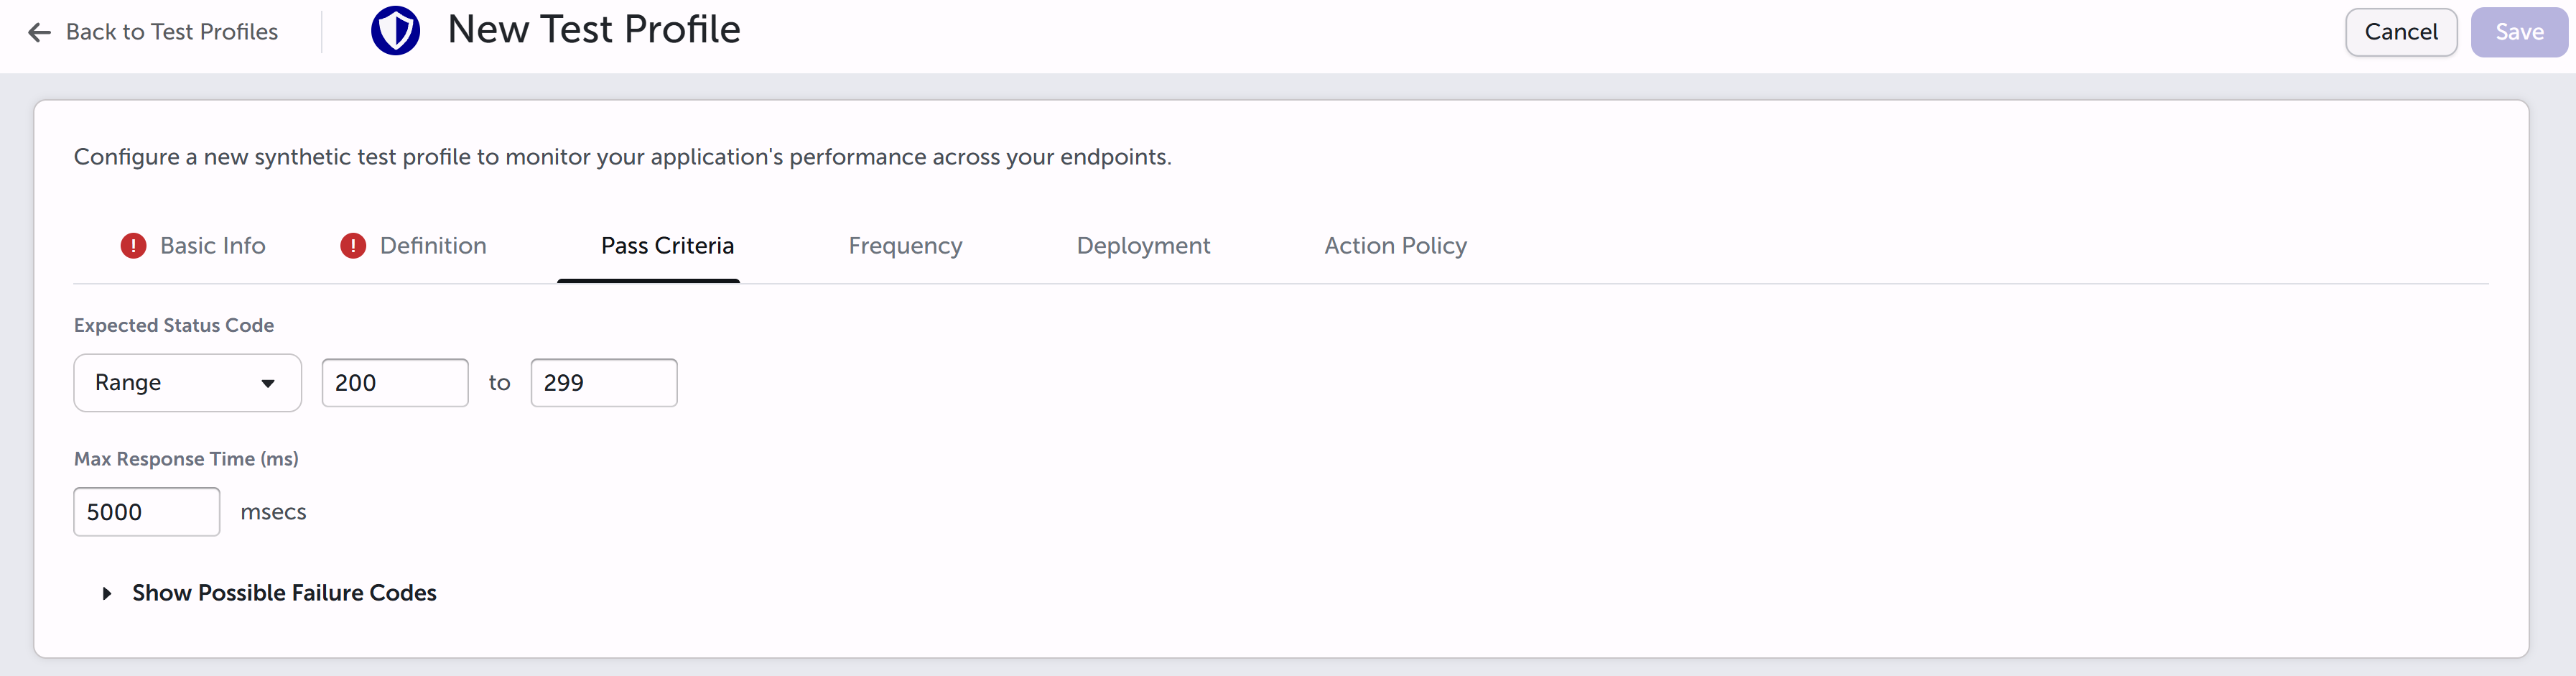
The Pass Criteria tab sets when a single run passes or fails. Every test type includes the optional Max Response Time (ms) field, the longest response time a passing run can have. The other fields depend on the test type. For example, an HTTP URL test checks the returned status code, and a DNS Lookup test can check the returned IP (Internet Protocol) addresses. For the fields of each type, see the test type topics listed under Definition tab.
A run that does not meet the criteria, times out, or hits an error has a status of Fail. Each failed run is a violation A single test run that fails, either because the result does not meet the pass criteria or because the test times out. In Core Assurance, a violation is recorded as a test status of Fail. and counts toward the trigger on the Action Policy tab. Click Show Possible Failure Codes to see the failure codes for the selected test type. See Core Assurance Failure Codes.
Frequency tab
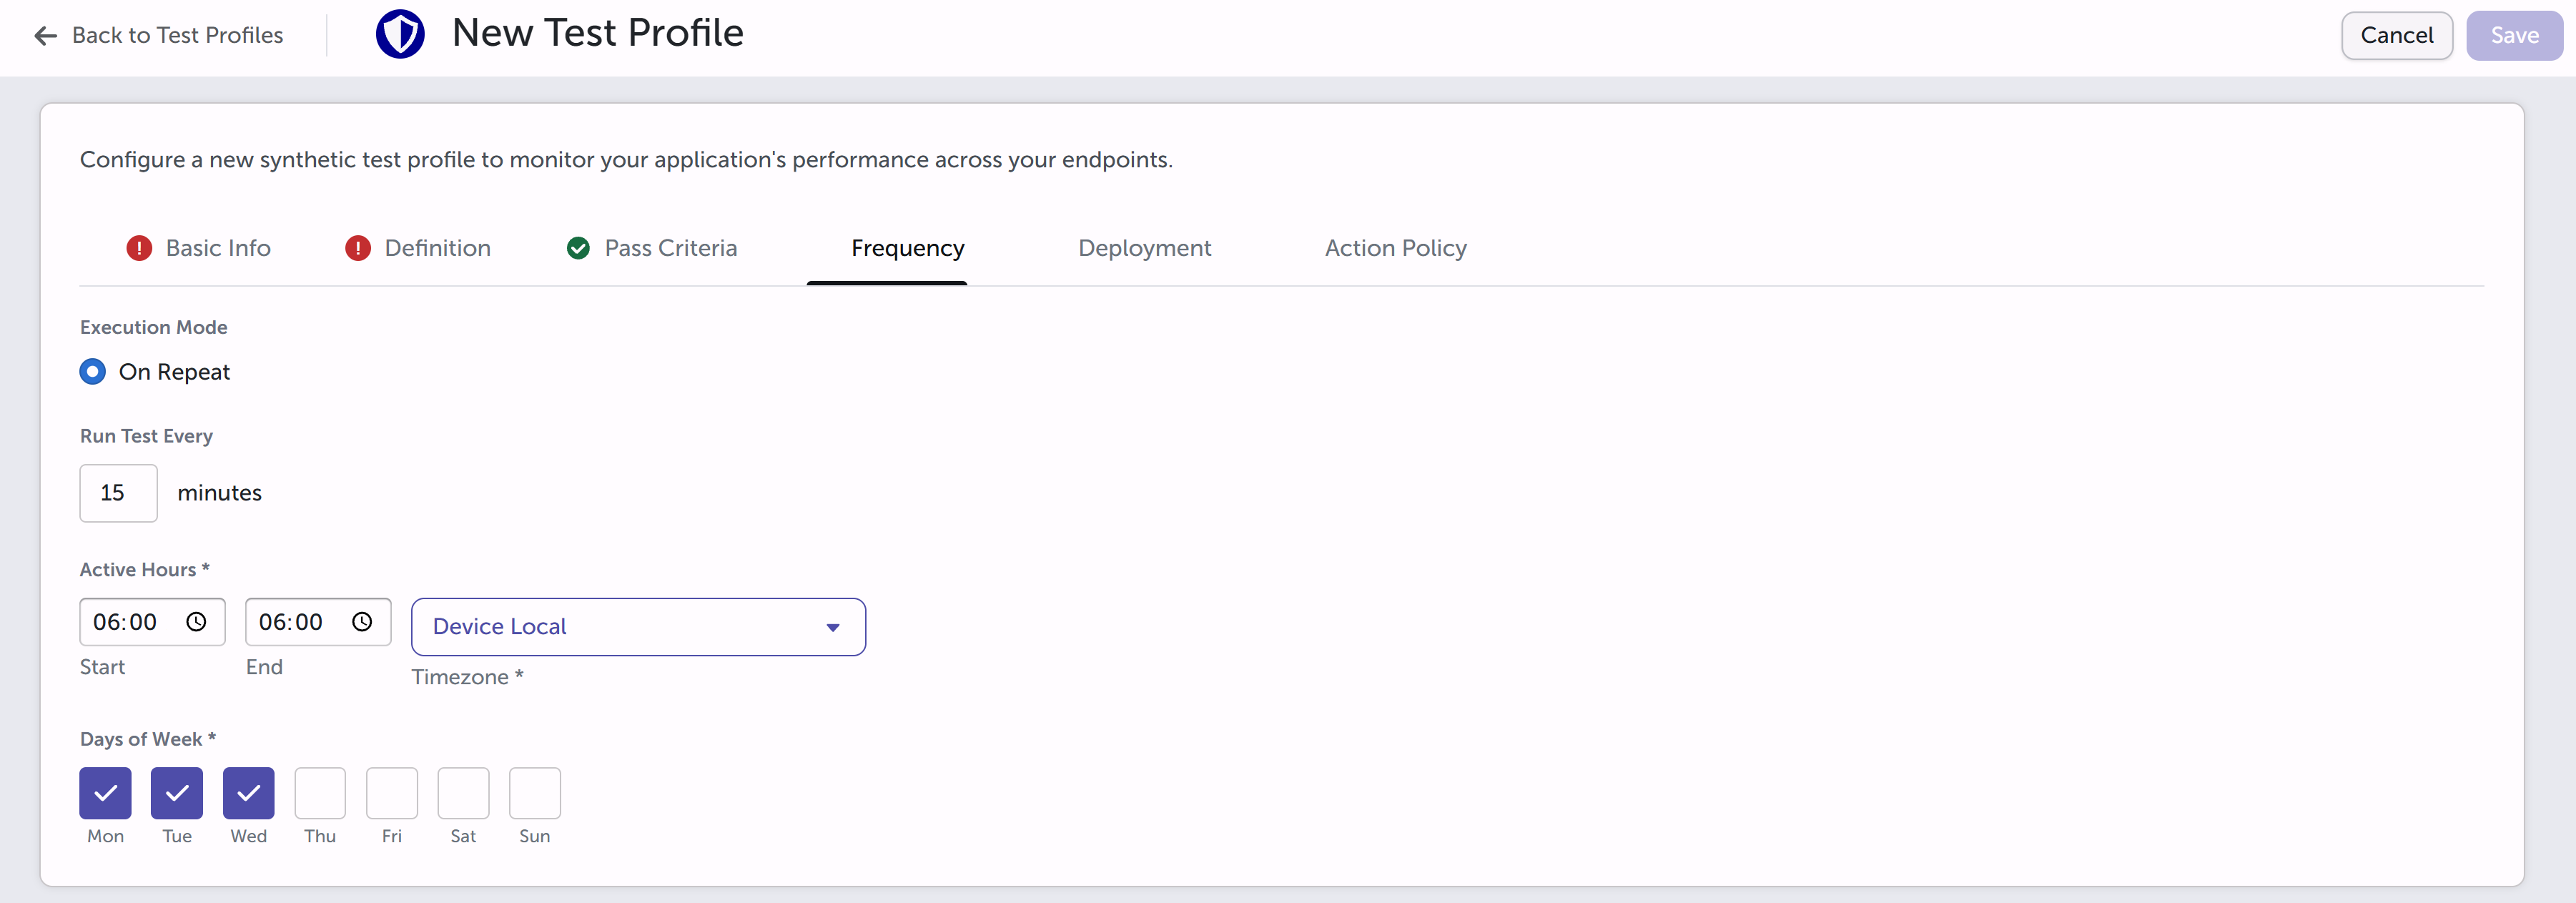
The Frequency tab sets when endpoints run the test. The Execution Mode is On Repeat, which runs the test continuously on a schedule. Runs of the same profile cannot overlap on an endpoint. If a run is still in progress when the next run is due, the next run fails with the TEST_ALREADY_ACTIVE code.
-
Run Test Every: The interval between runs. The interval is fixed at 15 minutes.
-
Active Hours (required): The Start and End times of the daily window when the schedule is in effect. The default window is 06:00 to 18:00.
-
Timezone (required): Device Local uses the time zone of each endpoint. Or select a fixed IANA (Internet Assigned Numbers Authority) time zone from the list so that every endpoint uses the same clock.
-
Days of Week (required): The days the schedule is active. Select at least one day. Monday, Tuesday, and Wednesday are selected by default.
For example, a profile can run every 15 minutes from 06:00 to 18:00, Monday through Friday, in the local time of each endpoint.
Deployment tab
The Deployment tab sets the endpoints where the test profile runs. The tab labels endpoints as devices. Available Devices lists the endpoints that have the Core Assurance module installed and do not have the profile yet. Selected Devices lists the endpoints that will run the profile. For how an endpoint gets the module, see Prepare Test Endpoints.
-
Type in Search devices... to find endpoints by name or location.
-
Select endpoints, then click Add > to move the endpoints to Selected Devices.
-
Select endpoints in Selected Devices, then click < Remove to unassign the endpoints.
Each endpoint shows a status color. Online endpoints show green, and offline endpoints show gray. You can assign offline endpoints too. Offline endpoints sync the profile when they reconnect.
Action Policy tab
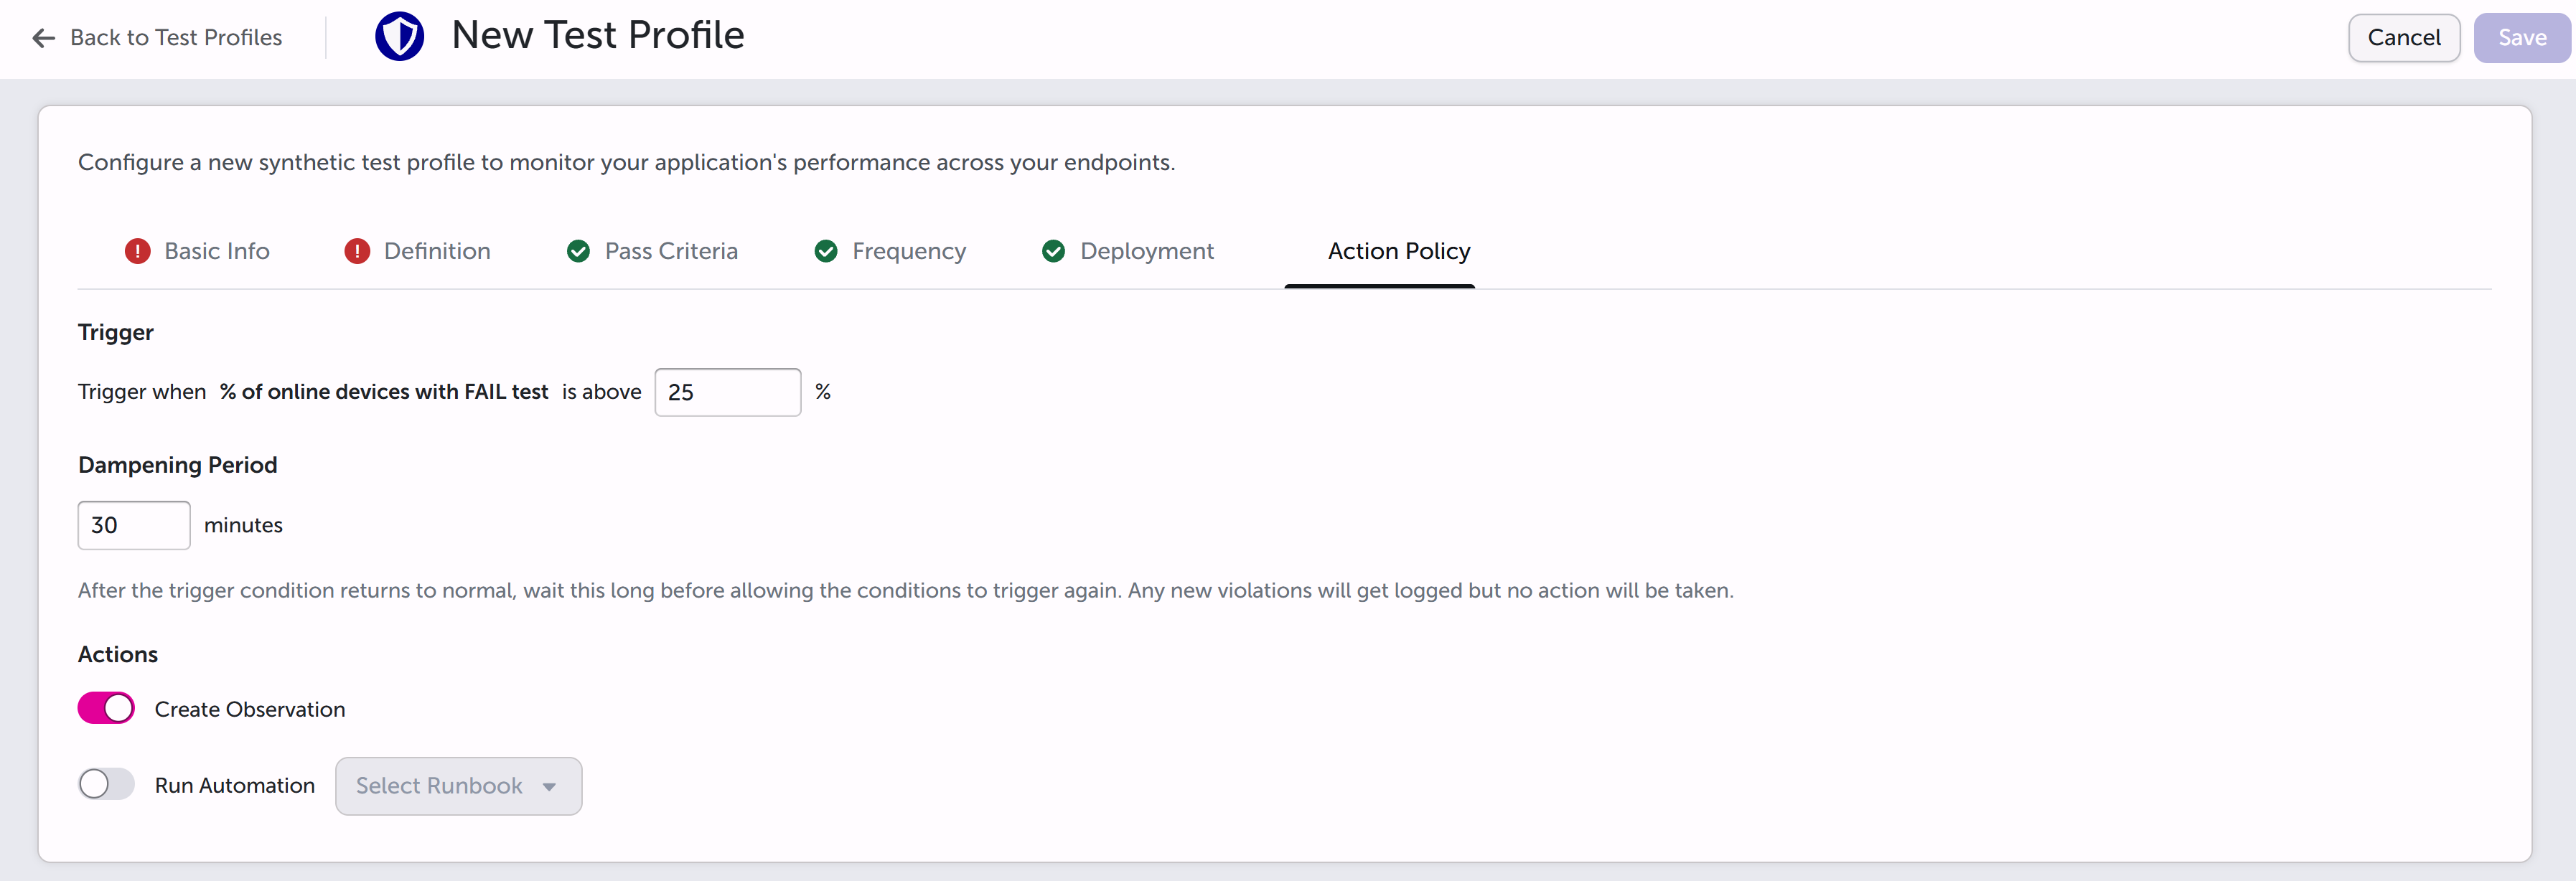
The Action Policy tab sets the action policy The part of a Core Assurance test profile that decides when to act and what to do. An action policy sets the failure trigger, the dampening period, and whether to create an observation, run an automation, or both., which decides when Core Assurance takes action and what Core Assurance does.
-
Trigger: Core Assurance takes action when the percentage of online endpoints with a failed test is above the trigger value. The on-screen label reads % of online devices with FAIL test is above. Enter a whole number between one and 100. The default is 25. For example, if a profile with a 25% trigger is deployed on 100 endpoints and all of the endpoints are online, the action triggers when more than 25 endpoints fail the test. Offline endpoints are not counted in the percentage.
-
Dampening Period: How many minutes to wait after the trigger condition returns to normal before the conditions can trigger again. Enter a whole number from one to 1440 (24 hours). The default is 30. New violations during the dampening period are logged, but no new action is taken.
-
Create Observation: Turn on to create or update an observation when the trigger is met. The action is on by default.
-
Run Automation: Turn on to run a runbook
An automated workflow that executes a series of steps or tasks in response to a triggered event, such as the detection of anomalous behavior generating an incident, a lifecycle event, or a manually executed runbook. as an automation Automated procedures that are executed as the result of a trigger. Automations consist of a single entry point and a sequence of connected nodes that define the processing logic. when the trigger is met, then choose the runbook in Select Runbook. The list shows the on-demand runbooks A runbook that triggers as required, either manually on-demand or as scheduled, to collect critical data and assist users with investigation tasks. in your tenant that are ready to run. A runbook is required when Run Automation is on. See On-Demand Runbooks.
For how a profile opens and closes an observation, see Core Assurance Observations.