Data Forensics Widgets Panel Controls and Layouts
Selecting a value in a table filters all panels and widgets below that table. Selecting a value in any panel filters only the panels beneath it. Selecting a time range on a chart filters related widgets according to your layout. You can also apply a chart selection as the global time range for the whole workspace; see Set Global Time Range from a Time Chart.
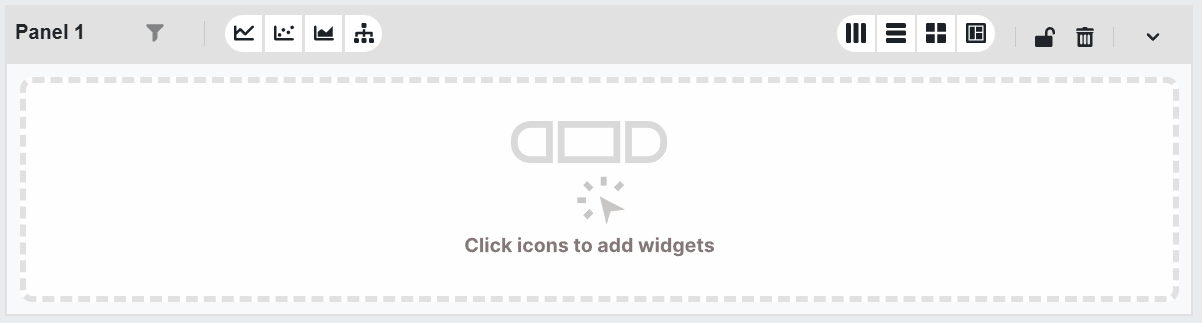
The following list describes the controls in the panel toolbar (Data Forensics, panel drilldown mode):
-
Panel title: Editable panel label.
-
Show/hide filters: Toggle the filter bar for the panel.
-
Add charts and tables: Buttons to add widgets to the panel. Which buttons appear depends on the data source (object type) of the main table above. Options can include Table, Breakdown Table, Time Chart, Pie, Bar, Bubble, Sparkline, Correlation Chart, Response Time Composition (RTC), a Transactions menu, and a Drilldown menu (to add a table that drills down from the selected row above).
-
Layout: Change how widgets are arranged (Horizontal, Vertical, Grid, or Custom).
-
Lock/unlock: Lock all widgets in the panel to prevent dragging or editing. Locking does not affect filtering.
Note: Locking widgets prevents dragging or editing them, but does not affect filtering behavior. -
Remove panel: Remove the panel and all widgets in it.
-
Collapse/expand: Collapse or expand the panel.
Example setup
Consider the following configuration:
-
Panel A: Product Category breakdown (bar chart).
-
Panel B: Monthly sales trend for selected category (line chart).
With an interaction defined between Panel A and Panel B, selecting a bar in the top panel dynamically filters the bottom panel. The filter bar applies a global time range to both.
Adding new panels
To add a blank panel:
-
Click Add New Panel at the bottom of the Data Forensics workspace.
-
Select widgets to populate the new panel.
-
Use layout and filtering options to configure as needed.
There is no limit to the number of panels you can add. Use multiple panels to compare different views, metrics, or group bys![]() In Workspaces Data Forensics, a dimension (e.g. application, host, service, client IP) that you choose from the sidebar to load data into the main table. Data is aggregated or broken down by that dimension. The sidebar lists available group bys for the selected analysis workspace. side-by-side.
In Workspaces Data Forensics, a dimension (e.g. application, host, service, client IP) that you choose from the sidebar to load data into the main table. Data is aggregated or broken down by that dimension. The sidebar lists available group bys for the selected analysis workspace. side-by-side.
For more detail about using multiple panels, see Multi-Panel Workspaces and Cascading Filters.