Multi-Panel Workspaces and Cascading Filters
This topic explains how to use multiple panels in Data Forensics and how filters cascade from top to bottom. You can create several panels at once. Each panel can contain visualizations (Time Series, Correlation, or Response Time Comparison) or act as a second main table with drilldown to additional group bys![]() In Workspaces Data Forensics, a dimension (e.g. application, host, service, client IP) that you choose from the sidebar to load data into the main table. Data is aggregated or broken down by that dimension. The sidebar lists available group bys for the selected analysis workspace..
In Workspaces Data Forensics, a dimension (e.g. application, host, service, client IP) that you choose from the sidebar to load data into the main table. Data is aggregated or broken down by that dimension. The sidebar lists available group bys for the selected analysis workspace..
The following example uses:
-
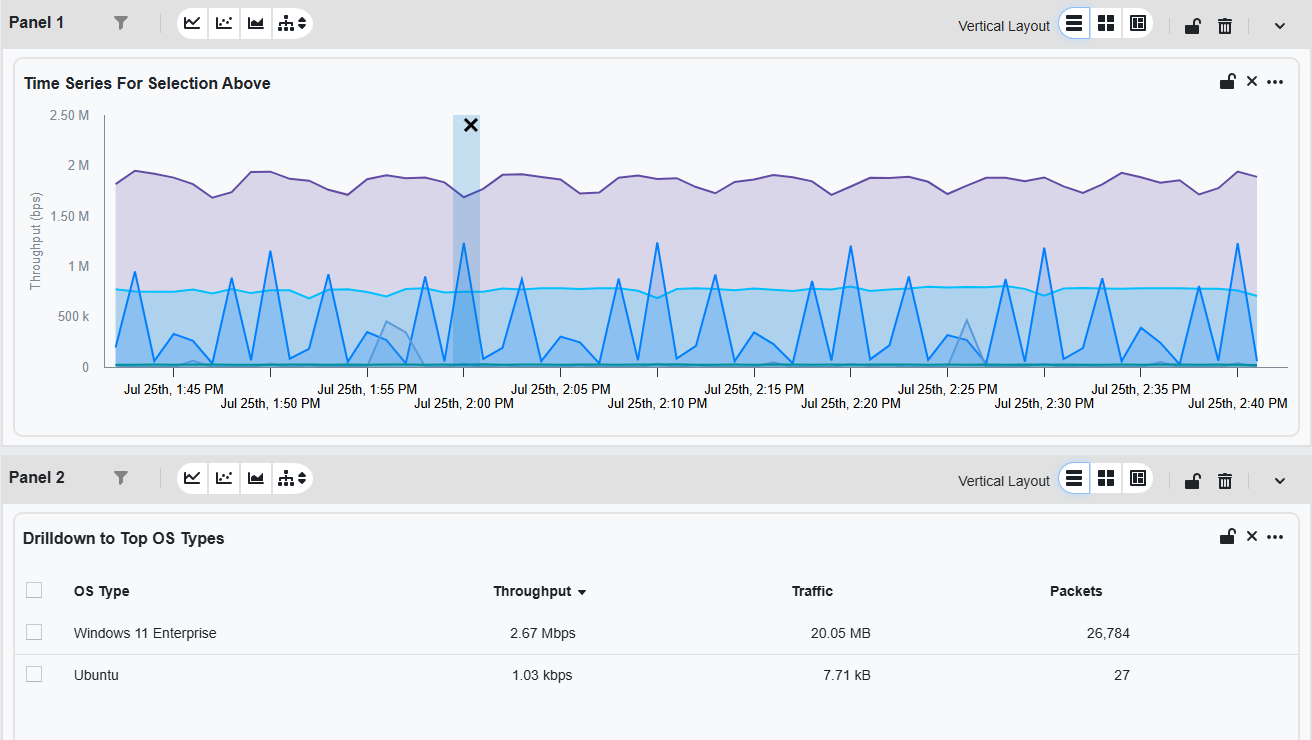
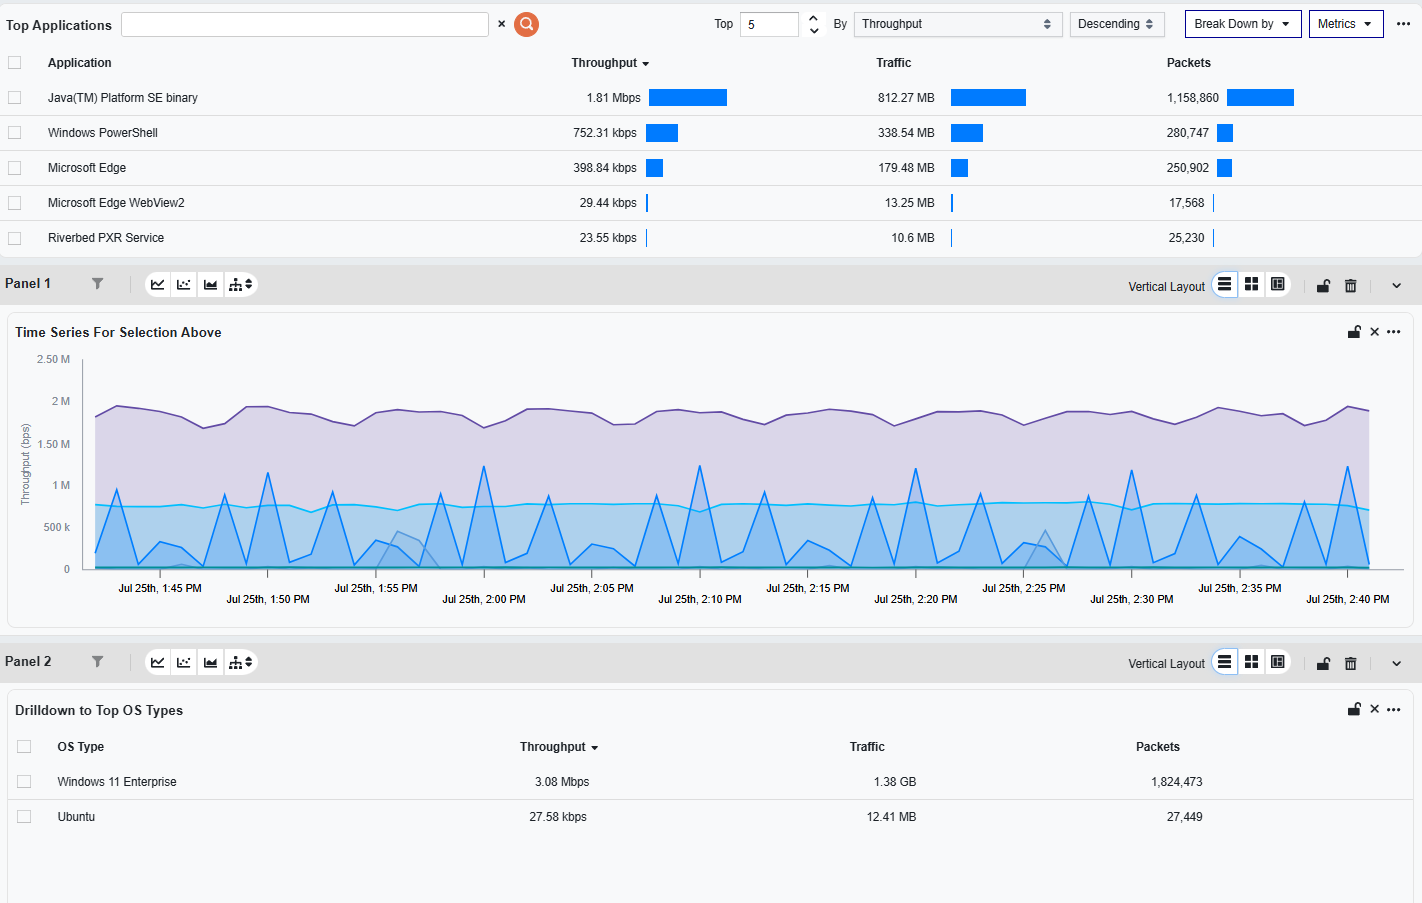
Main Table: Top Application
 An entity type representing software applications deployed in the customer environment that are monitored for performance and anomalies. group by.
 -
Panel 1: Time Series visualization from the Main Table.
-
Panel 2: Drilldown table to top OS types.
In the example above, Panel 2 functions as a second Main Table where you can filter, visualize, and drill down further. That setup allows you to visualize a spike of data for a specific application and drill down to the OS to begin further filtering to where the problem may be.
How cascading works: When you apply a filter using the filter bar at the top of the workspace, all panels update to reflect the filtered data. For example, selecting a value in a table panel can automatically update a chart panel and a details panel to show only information relevant to your selection.
Using the filter bar across panels
The Data Forensics Main Table’s global Filter Bar applies filters across all panels unless filters are explicitly overridden within an individual panel’s widgets.
For example, if you filter by OS Type equals Ubuntu in the Filter Bar, all panels update to reflect that constraint.
How information cascades through panels
When a global filter is applied, it cascades top-down through the panels. This means:
-
Filters are applied in order, panel by panel.
-
Widget-level filters refine the results of the panel-level view.
-
If interactions are configured between widgets in separate panels, the interaction logic takes precedence over global filters.
This cascading model allows you to set up interdependent panels. For instance, Panel 1 might contain a bar chart with a time series chart. Selecting a time span in that panel reduces the scope of the following panels to only the span of time selected. So Panel 2 will only display the Drilldown to Top OS Types data that exists in the selected timeframe.
To apply the span you selected on a time chart as the workspace-wide global time range (so every time-aware widget reloads for that window), use the calendar action on the chart selection. For those actions, see Set Global Time Range from a Time Chart.