Simple Runbook Examples
Runbooks![]() An automated workflow that executes a series of steps or tasks in response to a triggered event, such as the detection of anomalous behavior generating an incident, a lifecycle event, or a manually executed runbook. are automated investigations of network incidents
An automated workflow that executes a series of steps or tasks in response to a triggered event, such as the detection of anomalous behavior generating an incident, a lifecycle event, or a manually executed runbook. are automated investigations of network incidents![]() A collection of one or more related triggers. Relationships that cause triggers to be combined into incidents include application, location, operating system, or a trigger by itself.. Very simply, a runbook executes in response to a triggering
A collection of one or more related triggers. Relationships that cause triggers to be combined into incidents include application, location, operating system, or a trigger by itself.. Very simply, a runbook executes in response to a triggering![]() A set of one or more indicators that have been correlated based on certain relationships, such as time, metric type, application affected, location, or network device. entity
A set of one or more indicators that have been correlated based on certain relationships, such as time, metric type, application affected, location, or network device. entity![]() Things deployed in the customer environment that are needed to run the business, such as applications, devices, interfaces, and locations. and produces one or more outputs
Things deployed in the customer environment that are needed to run the business, such as applications, devices, interfaces, and locations. and produces one or more outputs![]() A document containing data sets generated by the execution of a runbook, including output of queries and reports from point products, as well as output of analysis or other runbook nodes. (visualizations
A document containing data sets generated by the execution of a runbook, including output of queries and reports from point products, as well as output of analysis or other runbook nodes. (visualizations![]() A runbook node category that shows data in a chart, graph, table, or note, providing visual representation of analysis results in runbook output. and impacts
A runbook node category that shows data in a chart, graph, table, or note, providing visual representation of analysis results in runbook output. and impacts![]() Uniform Resource Locator. The address used to access resources on the internet, such as webhook endpoints or API endpoints for runbook automation.) that describe the incident. To produce output from the triggering entity, the runbook queries for data that it can manipulate in a variety of ways. All of these functions are represented by configurable runbook nodes
Uniform Resource Locator. The address used to access resources on the internet, such as webhook endpoints or API endpoints for runbook automation.) that describe the incident. To produce output from the triggering entity, the runbook queries for data that it can manipulate in a variety of ways. All of these functions are represented by configurable runbook nodes![]() Individual components that make up a runbook automation, each performing a specific function such as data queries, transformations, logic, integrations, or visualizations., and every runbook, whether it is built-in or custom (user-created), is defined by a sequence of these nodes that starts with a single triggering entity and ends in one or more visualizations or impacts. The nodes are visible in the runbook definition, and the Runbook Editor enables you to create and change runbook definitions by arranging and connecting nodes in sequence.
Individual components that make up a runbook automation, each performing a specific function such as data queries, transformations, logic, integrations, or visualizations., and every runbook, whether it is built-in or custom (user-created), is defined by a sequence of these nodes that starts with a single triggering entity and ends in one or more visualizations or impacts. The nodes are visible in the runbook definition, and the Runbook Editor enables you to create and change runbook definitions by arranging and connecting nodes in sequence.
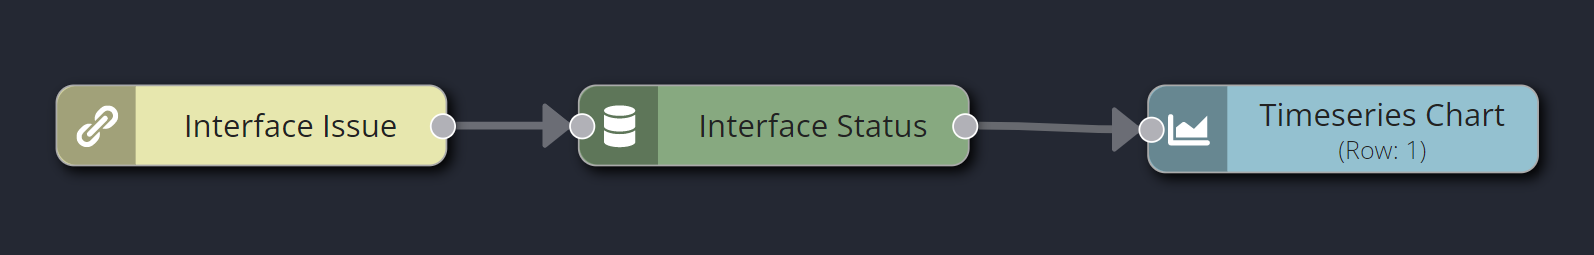
An extremely simple example of a runbook follows. This runbook executes in response to an Interface![]() An entity type representing network interfaces on devices that are monitored for performance metrics and anomalies. issue. The runbook queries for interface status
An entity type representing network interfaces on devices that are monitored for performance metrics and anomalies. issue. The runbook queries for interface status![]() The current state of an incident or runbook, indicating its progress through investigation and resolution workflows. information and forwards it to a time series chart, which displays interface status over time. The runbook definition looks like this:
The current state of an incident or runbook, indicating its progress through investigation and resolution workflows. information and forwards it to a time series chart, which displays interface status over time. The runbook definition looks like this:
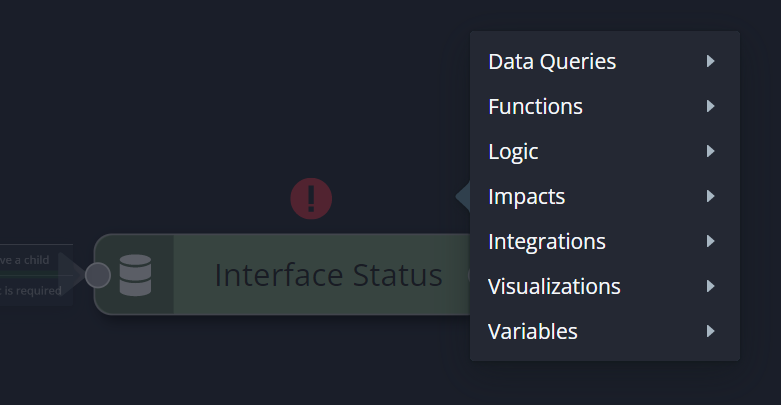
When the Runbook Editor is open, you can add a node to a runbook definition by dragging and dropping it from the Node palette at the left. As shown in the last example, a few node types are required for having a working runbook:
-
You must have a triggering entity node (only one per runbook).
-
You must have at least one Data Query node. This queries the Data Ocean for data related to the triggering entity and forwards it to nodes that follow it.
-
You must have at least one Visualization node to show some results of the runbook's investigation.
The other runbook node types are optional, but you'll want to use them in various use cases to obtain meaningful results.
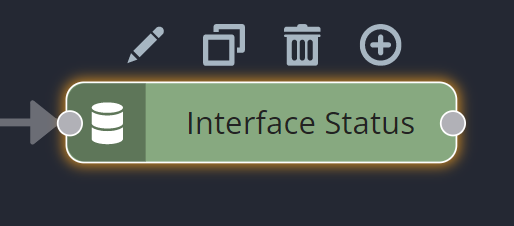
Every runbook node has a set of properties that control how it handles data. Depending on the node type, this can be the data it carries or the data it queries, or how it manipulates or displays data. Access a node's properties in the Runbook Editor by selecting the node on the canvas and clicking the pencil icon above it. The Properties open in a pane at the right.
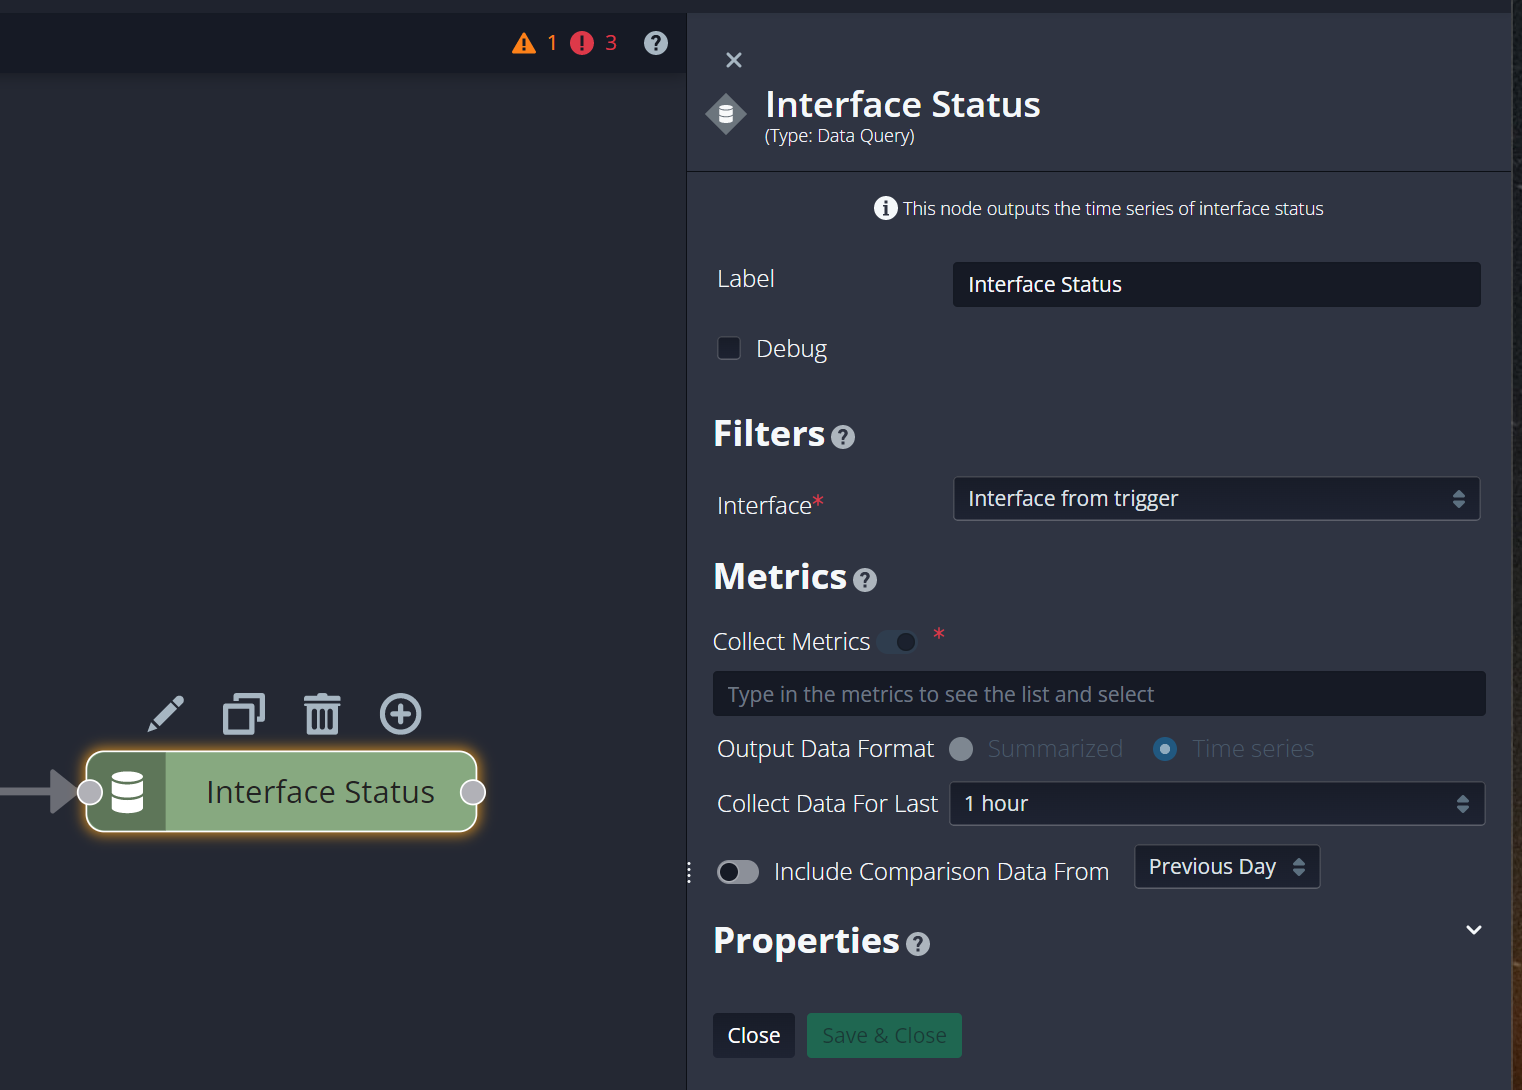
Note that the Save & Close button becomes accessible only if you change any of the properties.
As mentioned before, runbooks can include nodes that manipulate the data carried in the investigation. The Decision Branch node is a powerful node that enables you to create branches in the runbook sequence according to the evaluation of one or more logical conditions. For example, the next example is based on the last one, but has a Decision Branch and a second visualization added to it.
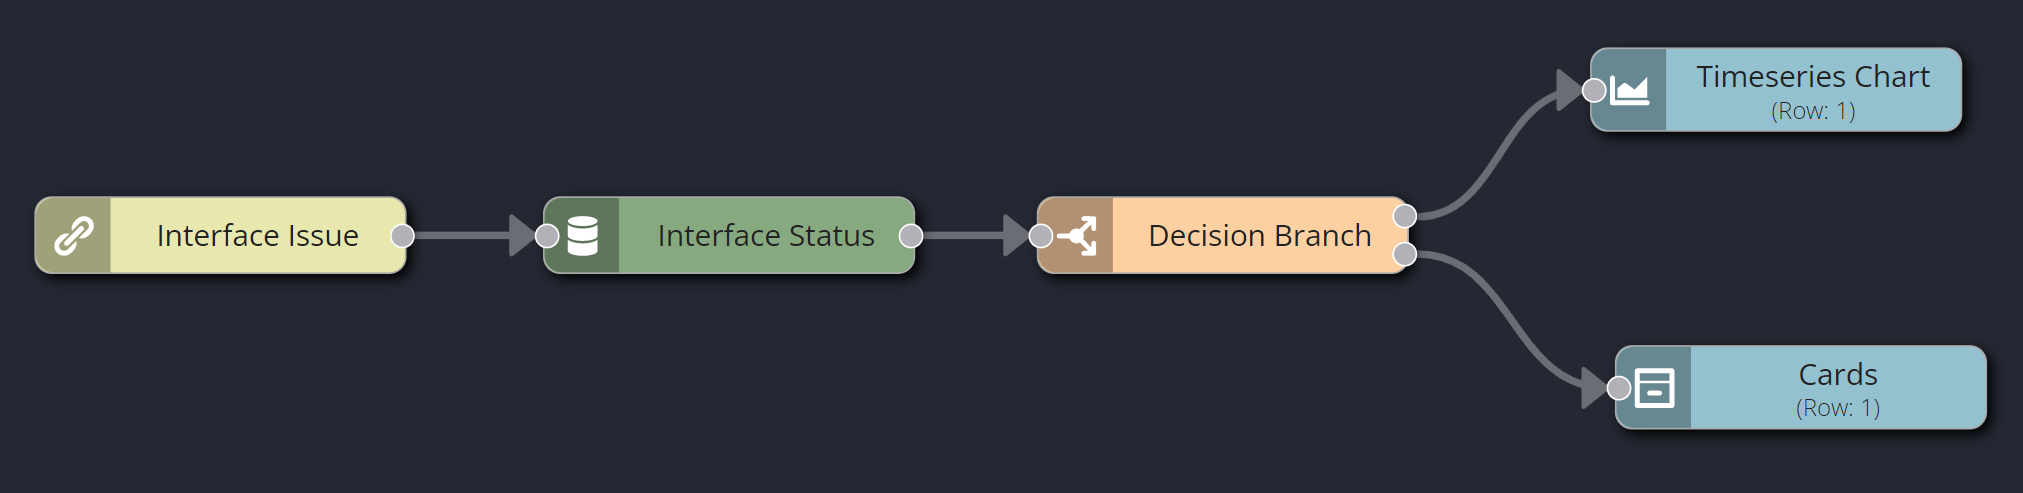
Finally, take a look at the built-in runbook named Application![]() An entity type representing software applications deployed in the customer environment that are monitored for performance and anomalies. Analysis. This runbook has a lot of nodes, but, if you begin at its triggering entity and follow its sequence along its separate branches, you'll see it's actually quite straightforward. Immediately following the Application Issue triggering entity, there are two Impact nodes, which call out all the applications and locations
An entity type representing software applications deployed in the customer environment that are monitored for performance and anomalies. Analysis. This runbook has a lot of nodes, but, if you begin at its triggering entity and follow its sequence along its separate branches, you'll see it's actually quite straightforward. Immediately following the Application Issue triggering entity, there are two Impact nodes, which call out all the applications and locations![]() An entity type representing physical or logical locations in the customer environment where entities are deployed and monitored. affected by the incident. Also attached directly to the Application Issue triggering entity is a Decision Branch, which, when you examine its properties, you'll see creates four different branches for the investigation to pursue: one for mean opinion score, one for response time/RTT, one for throughput, and one for the percentage of retrans packets. This one Decision Branch separates those different metrics
An entity type representing physical or logical locations in the customer environment where entities are deployed and monitored. affected by the incident. Also attached directly to the Application Issue triggering entity is a Decision Branch, which, when you examine its properties, you'll see creates four different branches for the investigation to pursue: one for mean opinion score, one for response time/RTT, one for throughput, and one for the percentage of retrans packets. This one Decision Branch separates those different metrics![]() A measurement or data point that is monitored and analyzed to detect anomalies and generate incidents. into their own sequences for investigation.
A measurement or data point that is monitored and analyzed to detect anomalies and generate incidents. into their own sequences for investigation.
Output 1, for which the triggering metric is MOS, connects to multiple distinct Data Query nodes, each one filtering for different MOS-related data, each one producing a different visualization or impact. Execute a test run to see the various outputs that result from four different paths of investigation from a single Decision Branch, stemming from a single triggering entity.
Now, try creating a new runbook that could investigate a common use case for your organization.