Device Down Runbook
Riverbed IQ Ops surfaces Device![]() An entity type representing network devices or hardware components deployed in the customer environment that are monitored for performance and anomalies. Down incidents
An entity type representing network devices or hardware components deployed in the customer environment that are monitored for performance and anomalies. Down incidents![]() A collection of one or more related triggers. Relationships that cause triggers to be combined into incidents include application, location, operating system, or a trigger by itself. when anomalies
A collection of one or more related triggers. Relationships that cause triggers to be combined into incidents include application, location, operating system, or a trigger by itself. when anomalies![]() An unexpected event or measurement that does not match the expected model. are detected in key measurements
An unexpected event or measurement that does not match the expected model. are detected in key measurements![]() A measurement or data point that is monitored and analyzed to detect anomalies and generate incidents. streaming from device entities
A measurement or data point that is monitored and analyzed to detect anomalies and generate incidents. streaming from device entities![]() Things deployed in the customer environment that are needed to run the business, such as applications, devices, interfaces, and locations., such as Device Status and Device Uptime.
Things deployed in the customer environment that are needed to run the business, such as applications, devices, interfaces, and locations., such as Device Status and Device Uptime.
The Device Down incident runbook is a built-in runbook accessible on the Incident Runbooks page; click Automation > Incident Runbooks. By default, the Device Down runbook is listed in the All Incident Runbooks and Built-In tabs. Alternatively, access the Device Down incident runbook via the Automation Management page; click Automation > Automation Management to display the Automation Management page. On the Automation Management page, look at New Incident Triggers and click the Device Down Issue card to display all the automations defined for Device Down issues. Find Device Down Issue (Default); this is the built-in Device Down incident runbook. Click Device Analysis in the Runbook column to open the runbook in the Runbook Editor.
The Device Down runbook comprises multiple parallel sequences (paths) originating from the single Device trigger![]() A set of one or more indicators that have been correlated based on certain relationships, such as time, metric type, application affected, location, or network device.:
A set of one or more indicators that have been correlated based on certain relationships, such as time, metric type, application affected, location, or network device.:
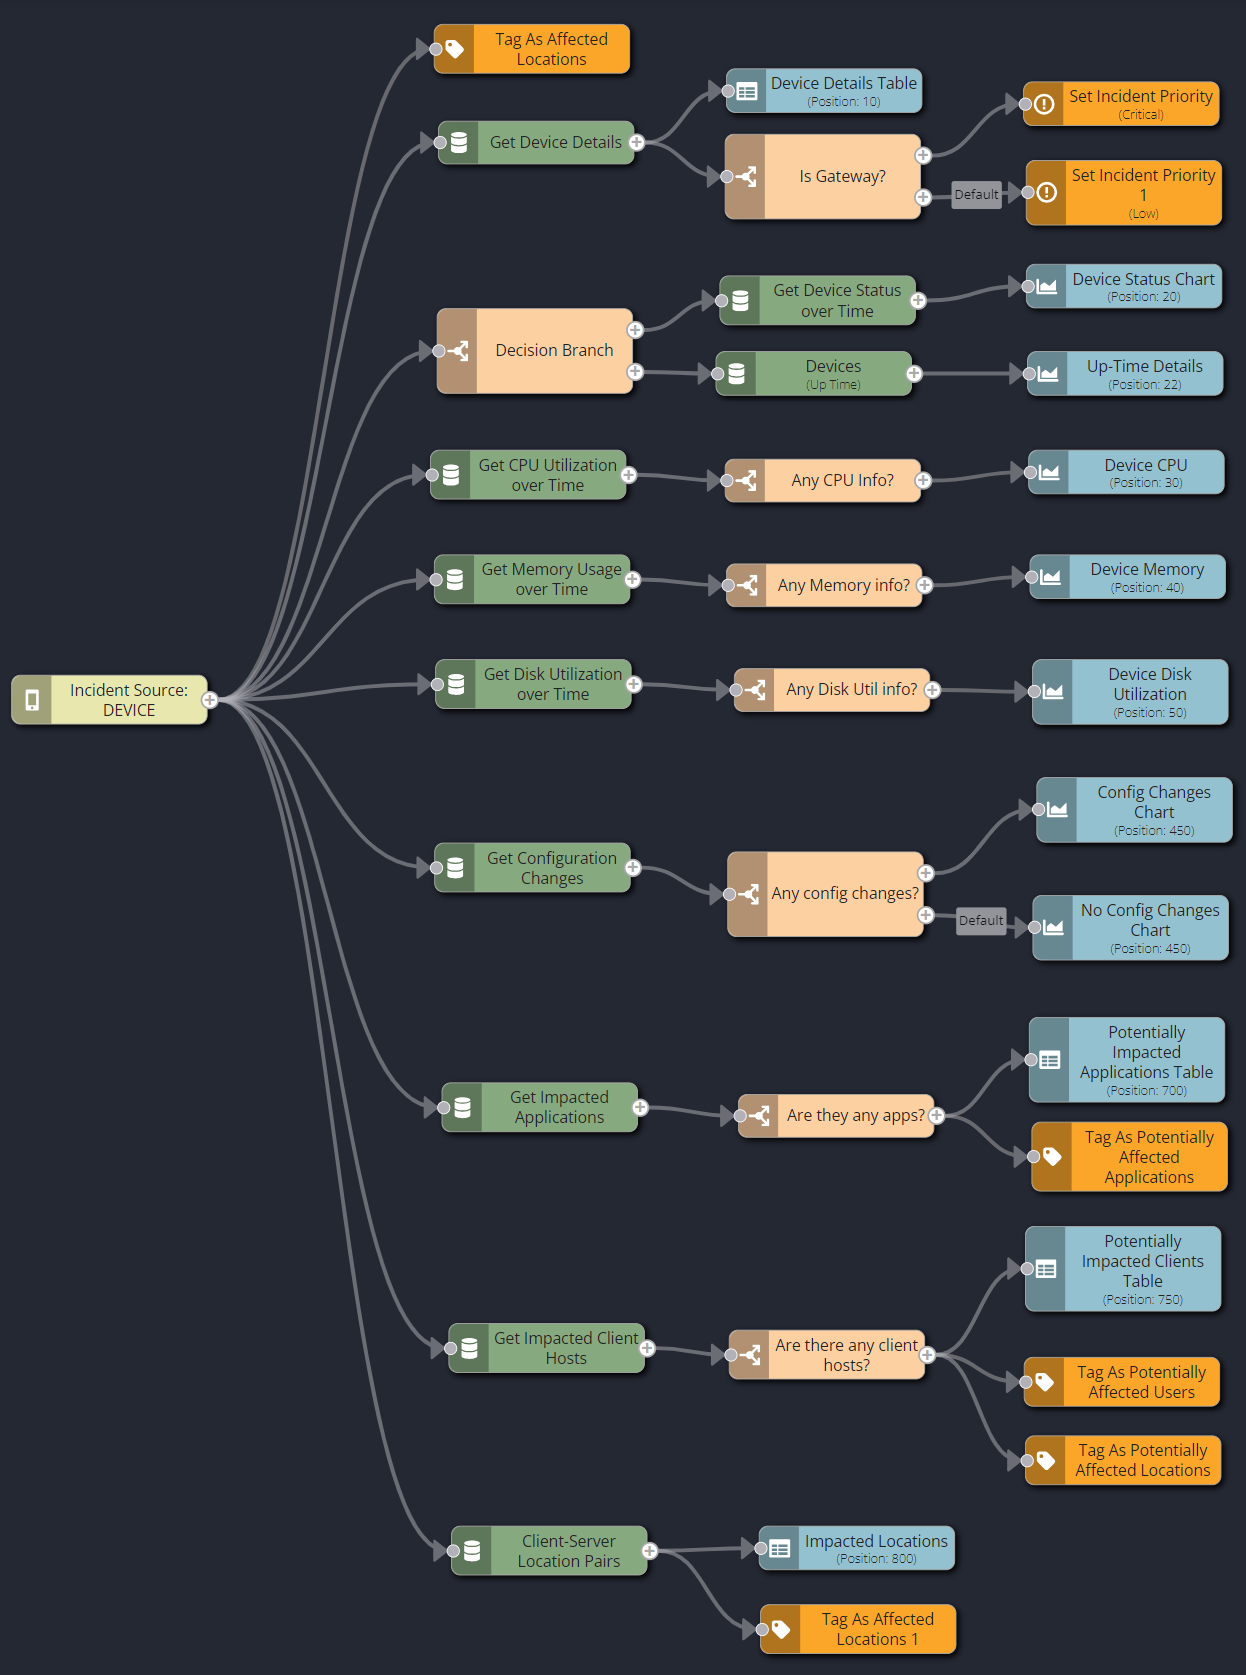
The figure below shows that runbook definition and its parallel paths as a collection of related inquiries all originating from the single entry point (trigger).
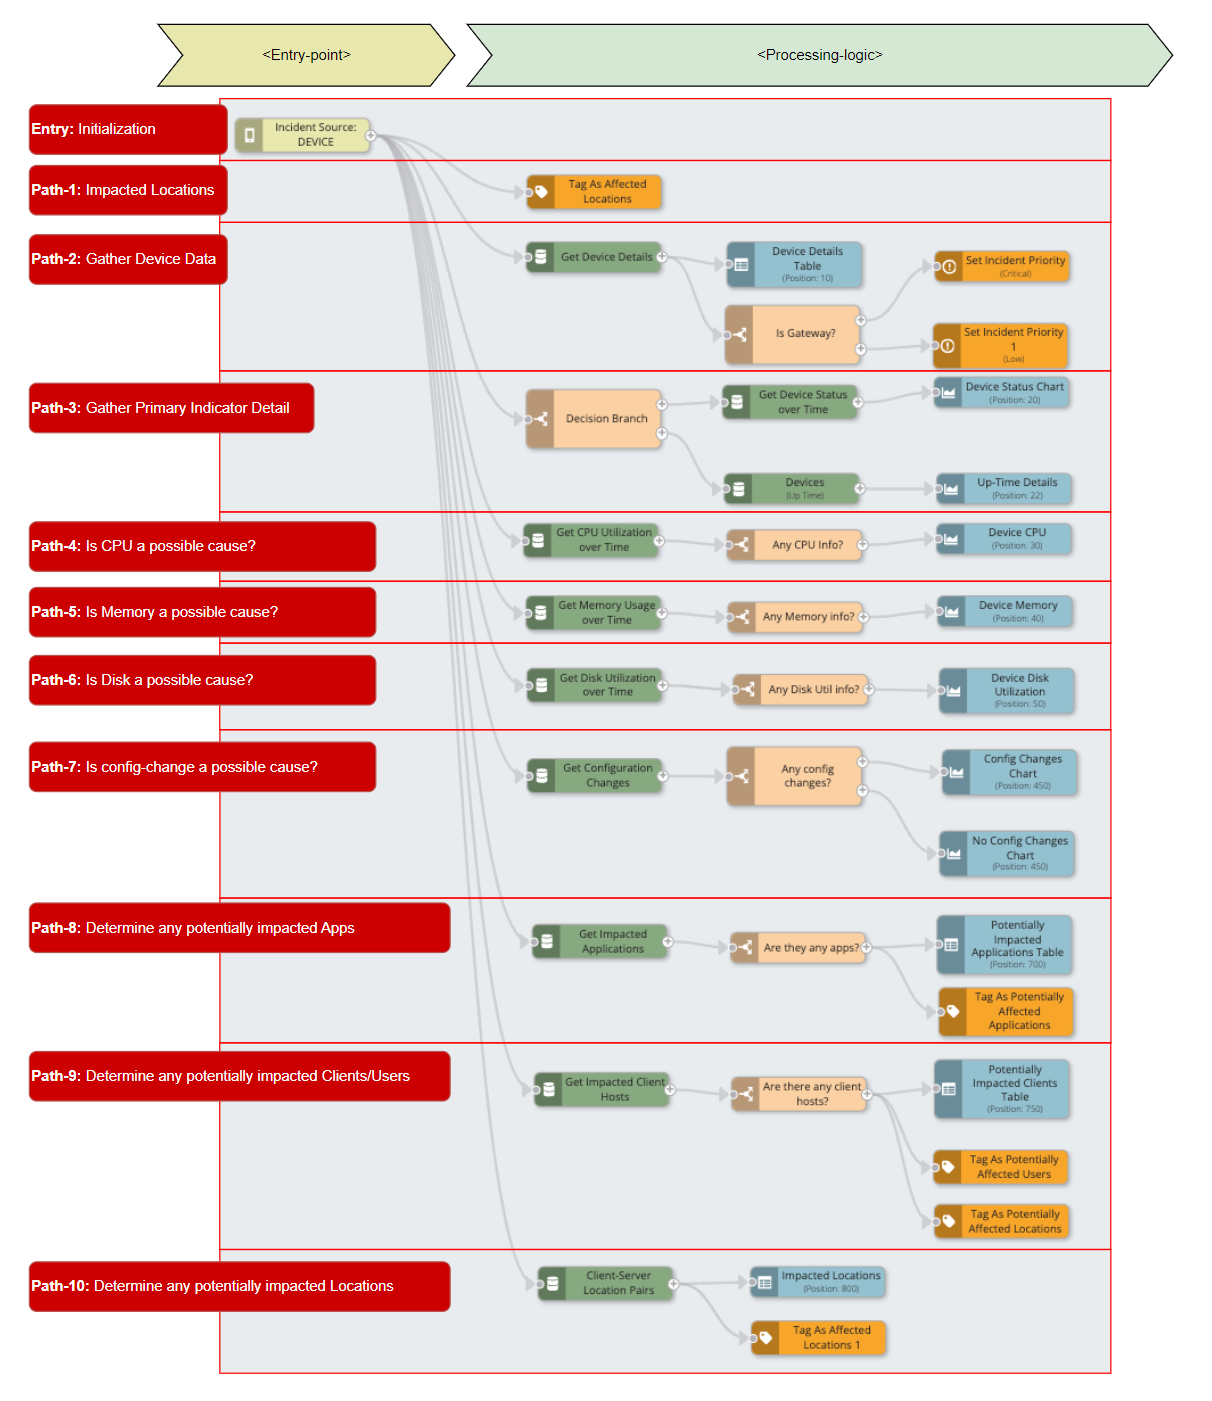
If you have not done so already, open the Device Analysis runbook in the Runbook Editor. Examine each path in turn by showing each node's properties:
-
Entry: Initialization: Every runbook requires a Triggering Entity as its entry point. This is the mechanism by which Riverbed IQ Ops passes all data/context gathered by the analytics pipeline (that generated the Incident) into the runbook automation. For the Devices trigger, the gathered analytics pipeline data/context will include primary and correlated indicators for the following key measurements:
-
Device Status
-
Device Uptime
-
-
Path-1: Impacted Locations: This immediately tags the source entity's location as impacted.
-
Path-2: Gather Device Data: This gathers additional detail for the source entity, and:
-
Visualizes the device detail as a table in the Runbook Analysis.
-
Checks the device detail to see if the source entity “Is Gateway” (i.e., critical resource), and:
-
Sets Priority to Critical if it is.
-
Otherwise, sets Priority to Low.
-
-
-
Path-3: Gather Primary Indicator Detail: This decides the path of execution based on the primary indicator (i.e., the key measurement metric that triggered this event) in order to gather additional relevant data/context:
-
If the triggering metric is Device Status, then:
-
Gather Device Status information for the period just prior to the event, and comparison data from the prior week.
-
Visualize the gathered Device Status information as a time series chart.
-
-
If the triggering metric is Device Uptime:
-
Gather Device Uptime information for the period just prior to the event, and comparison data from the previous day.
-
Visualize the gathered Device Uptime information as a time series chart.
-
-
-
Path-4: Is CPU a possible cause?: Gather additional data/context for CPU Utilization; a sudden CPU spike might indicate a problem leading to a device becoming unresponsive.
-
If available, visualize CPU Utilization as a time series chart.
-
-
Path-5: Is Memory a possible cause?: Gather additional data/context for Memory Usage; high memory usage might indicate a memory leak or an overload issue leading to a device becoming unresponsive:
-
If available, visualize Memory Usage as a time series chart.
-
-
Path-6: Is Disk a possible cause?: Gather additional data/context for Disk Utilization; a sudden increase in disk activity might indicate a problem leading to a device becoming unresponsive:
-
If available, visualize Disk Utilization as a time series chart.
-
-
Path-7: Is config-change a possible cause?: Gather additional data/context for configuration Changes; configuration changes on a device might cause a device to be temporarily unavailable:
-
If available, visualize Changes as a time series chart.
-
-
Path-8: Determine any potentially impacted Apps: Gather additional top 100 Application-related data/context for the source entity based on Throughput in order to assess potential impacts:
-
If available:
-
Visualize the list of top 100 potentially-impacted applications as a Table.
-
Tag the top 100 applications as potentially impacted.
-
-
-
Path-9: Determine any potentially impacted Clients/Users: Gather additional top 100 client-related data/context for the source entity based on Throughput in order to assess potential impacts:
-
If available:
-
Visualize the list of top 100 potentially-impacted clients as a table.
-
Tag the top 100 clients as potentially-impacted users.
-
Tag the top 100 client locations as as potentially impacted locations.
-
-
-
Path-10: Determine any potentially impacted Locations: Gather additional top 10 Client-Server Location Pairs for the source entity based on Throughput in order to assess potential impacts:
-
If available:
-
Visualize the list of top 10 potentially-impacted Locations as a table.
-
Tag the top ten locations as potentially-impacted locations.
-
-