AI Forecasting
The AI![]() Artificial Intelligence. Technology that applies intelligence and automation to observe environments, detect anomalous behavior, and execute automated investigations. Forecasting page shows the forecast of up to ten interfaces
Artificial Intelligence. Technology that applies intelligence and automation to observe environments, detect anomalous behavior, and execute automated investigations. Forecasting page shows the forecast of up to ten interfaces![]() An entity type representing network interfaces on devices that are monitored for performance metrics and anomalies.. Instructions on how to run a forecast may be found on
the Interfaces page. After a forecast is complete, the AI Forecasting page displays the results.
An entity type representing network interfaces on devices that are monitored for performance metrics and anomalies.. Instructions on how to run a forecast may be found on
the Interfaces page. After a forecast is complete, the AI Forecasting page displays the results.
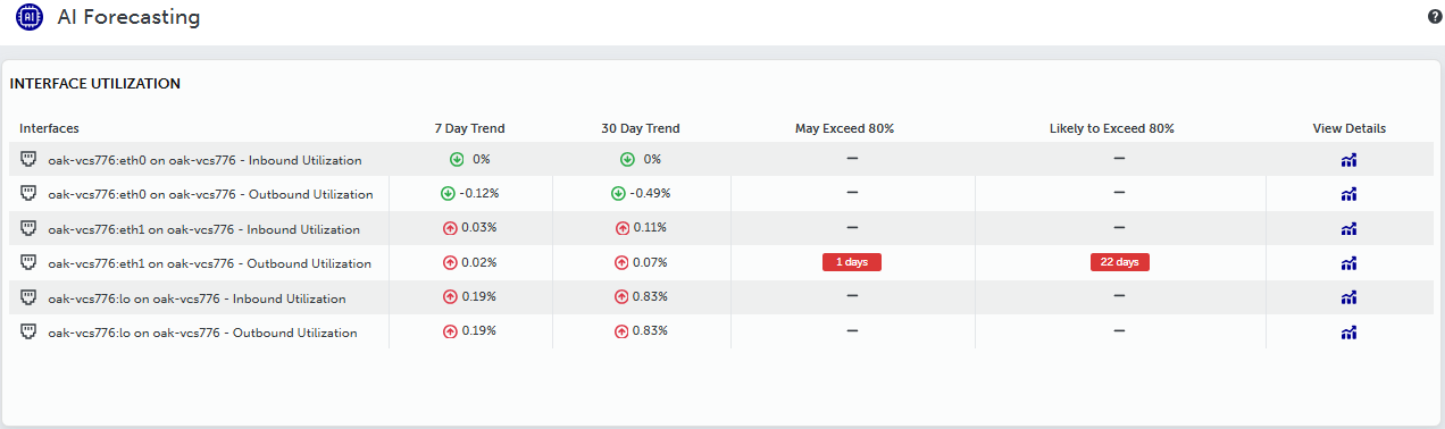
Here, the in- and out-utilizations are summarized for each selected interface![]() An entity type representing network interfaces on devices that are monitored for performance metrics and anomalies., as well as the predicted percentage change (up or down) for the next
7 days and 30 days. If the expected high value of the prediction range exceeds the threshold, the number of days until that happens is shown in the
May Exceed column. If the expected value of the prediction exceeds the threshold, the number of days until that happens is shown in the Likely to Exceed column.
An entity type representing network interfaces on devices that are monitored for performance metrics and anomalies., as well as the predicted percentage change (up or down) for the next
7 days and 30 days. If the expected high value of the prediction range exceeds the threshold, the number of days until that happens is shown in the
May Exceed column. If the expected value of the prediction exceeds the threshold, the number of days until that happens is shown in the Likely to Exceed column.
It is possible that new or lightly used interfaces![]() An entity type representing network interfaces on devices that are monitored for performance metrics and anomalies. do not have enough data to a accurately predict their utilizations
in the future. If this occurs, a red icon will appear over “View Details”. You can hover over the icon for more information.
An entity type representing network interfaces on devices that are monitored for performance metrics and anomalies. do not have enough data to a accurately predict their utilizations
in the future. If this occurs, a red icon will appear over “View Details”. You can hover over the icon for more information.
Click on the blue icon in View Details to render the historical data used to train the algorithm and the predicted values:
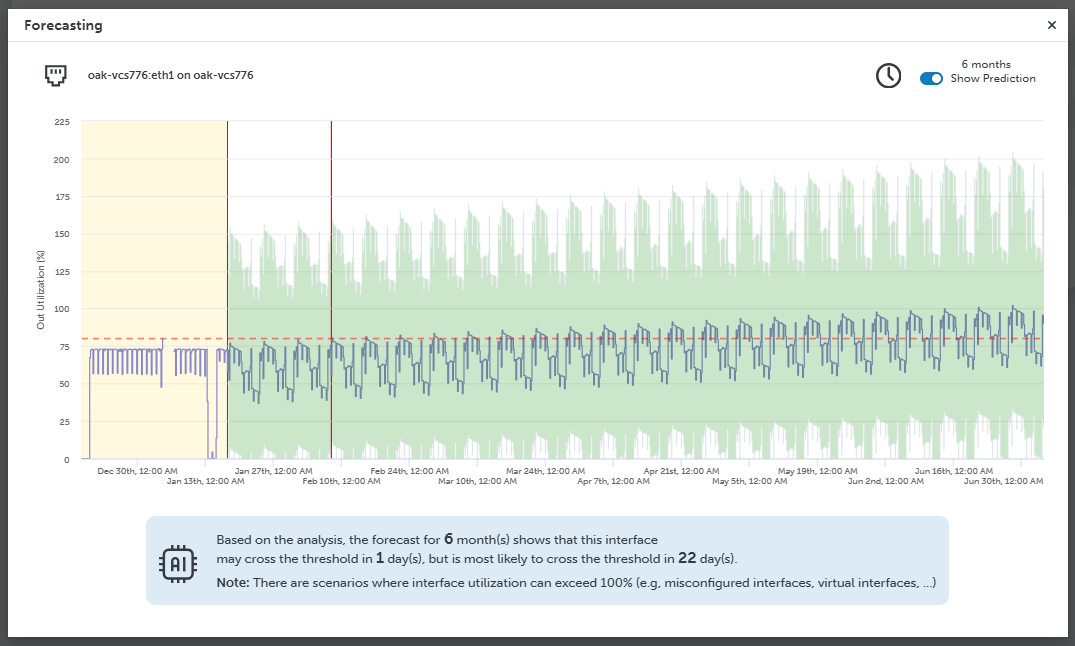
The yellow region shows historical data. The green region shows the predictions, with the expected normal range, based on the natural variability of the data.
Closing the summary table deletes the forecast data. You can regenerate the data by entering the desired time range and thresholds. Then click Show Forecast.