Per-Node Execution Detail - OUTPUT / Path-1: Investigation of issue with Metric: Interface Statuts
Data Queries: Interface Status
This node outputs the timeseries of Interface status. See the Data Queries: Interface Status page for more details.
The Example Interface![]() An entity type representing network interfaces on devices that are monitored for performance metrics and anomalies. Runbook employs Data Queries: Interface Status to gather additional data/context from the Data Ocean.
An entity type representing network interfaces on devices that are monitored for performance metrics and anomalies. Runbook employs Data Queries: Interface Status to gather additional data/context from the Data Ocean.
Example Interface Runbook configuration
The Example Interface Runbook configures Data Queries: Interface Status with:
-
Label: Default-value.
-
Filters / Interface
-
Interface from trigger: The Data Query should gather data/context for the Interface provided by the Trigger (i.e. the Primary Indicator).
-
-
Metrics:
-
Collect Metrics: Disabled.
-
Output Data Format:
-
Time series: Time series graphable format.
-
-
<Type in the metrics
 A measurement or data point that is monitored and analyzed to detect anomalies and generate incidents. to see the list and select>: Specifies that the Data Query must gather Metric: Interface An entity type representing network interfaces on devices that are monitored for performance metrics and anomalies. Status information for the specified Interface An entity type representing network interfaces on devices that are monitored for performance metrics and anomalies..
 -
Collect Data For Last : Specify Data Query is to gather data/context for the last 1 hour period.
-
Include Comparison Data From: Disabled
-
-
Output (Chevron): Default list of all possible Interface Properties for the Data Query to gather.
This set of Data Queries: Interface Status properties configures a Data Query that gathers additional Metric: Interface Status data/context for the Interface that triggered the Runbook execution (i.e. the Primary Indicator![]() An observed change in a specific metric stream that is recognized as being outside of an expected model. Indicators are correlated into triggers, and one or more triggers are grouped into incidents.), for the one hour interval preceding the time primary indicator + <15 minutes>.
An observed change in a specific metric stream that is recognized as being outside of an expected model. Indicators are correlated into triggers, and one or more triggers are grouped into incidents.), for the one hour interval preceding the time primary indicator + <15 minutes>.
Visualizaton: Timeseries Chart
This node shows the specified data in a time series chart. See the Visualization: Timeseries Chart page for more details.
The Example Interface![]() An entity type representing network interfaces on devices that are monitored for performance metrics and anomalies. Runbook employs Visualization: Timeseries Chart to visualize
An entity type representing network interfaces on devices that are monitored for performance metrics and anomalies. Runbook employs Visualization: Timeseries Chart to visualize![]() A runbook node category that shows data in a chart, graph, table, or note, providing visual representation of analysis results in runbook output. the Runbook Analysis of Metric: Interface
A runbook node category that shows data in a chart, graph, table, or note, providing visual representation of analysis results in runbook output. the Runbook Analysis of Metric: Interface![]() An entity type representing network interfaces on devices that are monitored for performance metrics and anomalies. Status information as a timeseries, e.g.:
An entity type representing network interfaces on devices that are monitored for performance metrics and anomalies. Status information as a timeseries, e.g.:
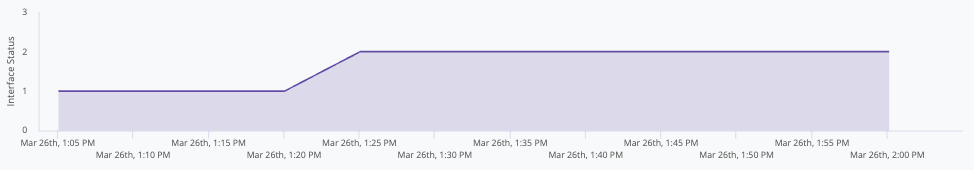
Sample: Visualization: Timeseries Chart for Metric: Interface Status
Example Interface Runbook configuration
The Example Interface Runbook configures Visualization: Timeseries Chart with:
-
Label: Default-value.
-
Position in Runbook Output
A document containing data sets generated by the execution of a runbook, including output of queries and reports from point products, as well as output of analysis or other runbook nodes.: 1 -
Metrics: Metric: Interface Status
-
Style: Area.
This set of Visualization: Timeseries Chart properties configures a Timeseries Area-graph for Metric: Interface Status from the Interface that generated the Incident and triggered the Runbook execution.