Interface Incident Runbook Node Details
This topic describes the properties panels of the Runbook![]() An automated workflow that executes a series of steps or tasks in response to a triggered event, such as the detection of anomalous behavior generating an incident, a lifecycle event, or a manually executed runbook. nodes
An automated workflow that executes a series of steps or tasks in response to a triggered event, such as the detection of anomalous behavior generating an incident, a lifecycle event, or a manually executed runbook. nodes![]() Individual components that make up a runbook automation, each performing a specific function such as data queries, transformations, logic, integrations, or visualizations. used in the Interface Incident Runbook.
Individual components that make up a runbook automation, each performing a specific function such as data queries, transformations, logic, integrations, or visualizations. used in the Interface Incident Runbook.
Triggering Entity: Interface
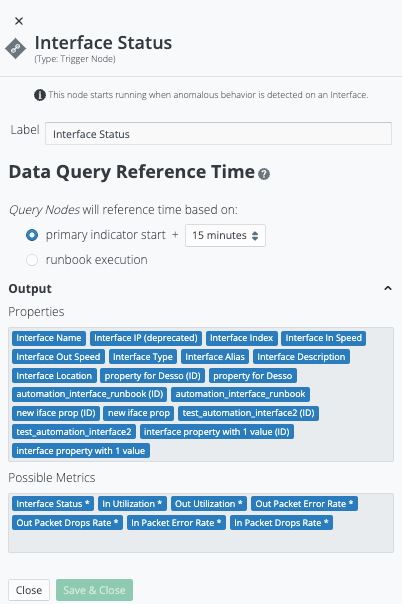
Triggering Entity: Interface has a set of properties that control the initial conditions for Runbook execution. You can access this set properties in the Runbook Editor by selecting the node on the canvas and clicking the pencil icon above it. The Properties open in a pane at the right.
Triggering Entity: Interface properties descriptions include:
-
Label: Can be changed from the default-value to provide a human-readable description of the node.
-
Data Query Reference Time: Specifies how Data Query nodes that follow this node in the Runbook will assess time:
-
primary indicator
 An observed change in a specific metric stream that is recognized as being outside of an expected model. Indicators are correlated into triggers, and one or more triggers are grouped into incidents. + pick-list: Data Query Nodes point of reference will be according to the origination of the primary indicator, plus an offset. For example, primary indicator + 15 minutes: causes Data Query nodes to request data for the 15-minutes preceding the timestamp of the Primary Indicator.
 -
runbook execution: Data Query Nodes point of reference will be based on the time of Runbook execution. For example, runbook execution: causes Data Query nodes to request data for the timestamp of the Runbook execution.
-
-
Output
A document containing data sets generated by the execution of a runbook, including output of queries and reports from point products, as well as output of analysis or other runbook nodes. (Chevron): Enumerates the list of possible Interface Properties and Metrics A measurement or data point that is monitored and analyzed to detect anomalies and generate incidents. that can be passed-thru the Trigger node. For example, if Primary Indicator: Interface Status The current state of an incident or runbook, indicating its progress through investigation and resolution workflows., then the Trigger will pass-thru Metrics: Interface Status. -
Close / Save & Close (buttons): Used to close this Properties pane after viewing, or to save and close this Properties pane after editing.
Logic A runbook node category that adds conditions to branch the runbook, enabling conditional execution paths based on data and context.: Decision Branch
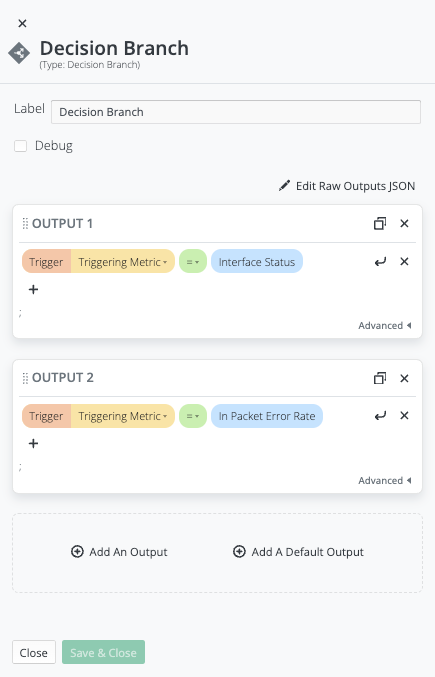
Logic: Decision Branch has the following set of properties that control the logic applied to available data/context (in this case the data/context supplied by the Trigger) to determine the desired path of Runbook execution. Access this set properties in the Runbook Editor by selecting the node on the canvas and clicking the pencil icon above it. The Properties open in a pane at the right.
Logic: Decision Branch properties descriptions:
Label: Can be changed from the default-value to provide a human-readable description of the node.
-
Debug: A checkbox that enables debug capabilities (e.g. logging of execution).
-
OUTPUTS: The set of logic-checks that determine the Path of Runbook execution (the first successful logic-check is followed).
-
add An Output (Button): Add another logic-check/OUTPUT.
-
add A Default Output (Button): Add default OUTPUT to process any unmatched items.
-
-
Close / Save & Close (buttons): Used to close this Properties pane after viewing, or to save and close this Properties pane after editing.
Data Queries: Interface Status
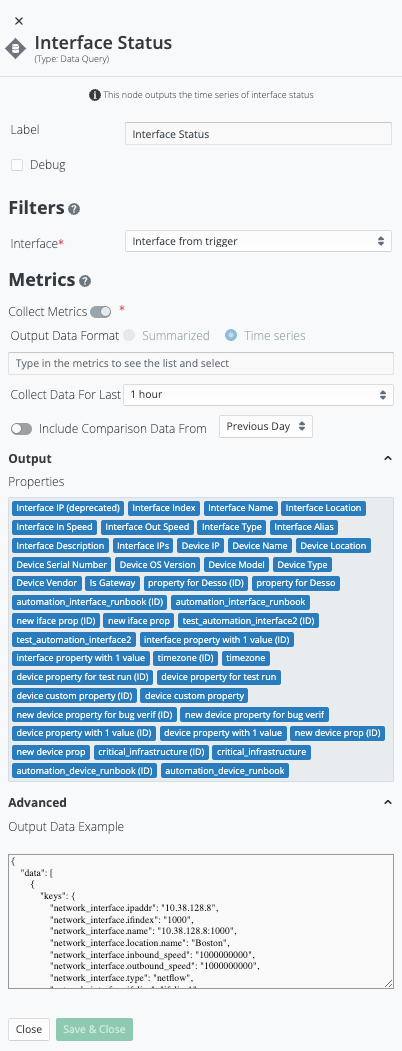
Data Queries: Interface Status has the following set of properties that control what data/context is queried, and in what format it is represented. Access this set properties in the Runbook Editor by selecting the node on the canvas and clicking the pencil icon above it. The Properties open in a pane at the right.
Data Queries: Interface Status properties descriptions:
-
Label: Can be changed from the default-value to provide a human-readable description of the node.
-
Debug: A checkbox that enables debug capabilities (e.g. logging of execution).
-
Filters / Interface: Pick-list that specifies how the Data Query should be filtered, e.g.:
-
Interface from trigger: The Data Query should gather data/context for the Interface provided by the Trigger (i.e. the Primary Indicator).
-
Interface from closest parent: The Data Query should gather data/context for the Interface provided by the closest/preceding Runbook node (e.g. an automated investigation may be exploring Interfaces beyond what triggered the Runbook execution).
-
-
Metrics
A measurement or data point that is monitored and analyzed to detect anomalies and generate incidents.: Specify the desired metrics A measurement or data point that is monitored and analyzed to detect anomalies and generate incidents. for the Data Query to gather.-
Collect Metrics: A toggle for enabling metrics collection.
-
Output Data Format: Select the desired format for the Data Query to output the data/context.
-
Summarized: Tabular summary.
-
Time series: Time series graphable format.
-
-
<Type in the metrics to see the list and select>: Specifies the metric (or list of metrics) this Data Query must gather for the requested Interface.
-
Collect Data For Last: Specify the period for which the Data Query is to gather data/context.
-
Include Comparison Data From: A toggle for enabling Data Query to also collect comparison data for an offset time period (i.e. Previous Day, one Week Prior, four Weeks Prior).
-
-
Output (Chevron): Enumerates the list of possible Interface Properties for the Data Query to gather.
-
Advanced (Chevron): Provides a detailed description of the JSON used to pass data from this node to the next.
-
Close / Save & Close (buttons): Used to close this Properties pane after viewing, or to save and close this Properties pane after editing.
Visualization: Timeseries Chart
Visualization: Timeseries Chart has the following set of properties that control the logic applied to available data/context (in this case the data/context supplied by the Trigger) to determine the desired path of Runbook execution. Access this set properties in the Runbook Editor by selecting the node on the canvas and clicking the pencil icon above it. The Properties open in a pane at the right.
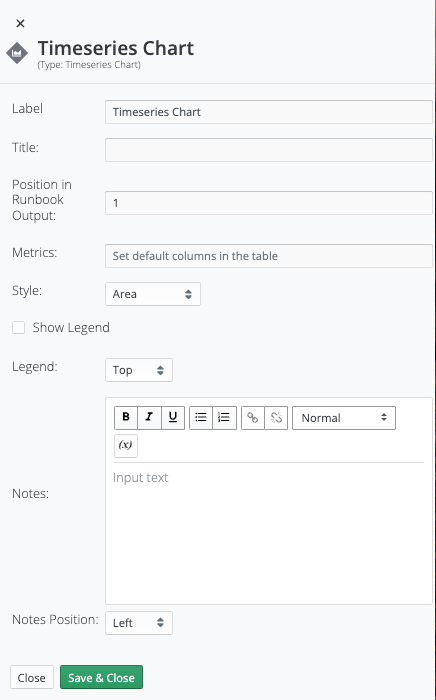
Visualization: Timeseries Chart properties descriptions:
-
Label: Can be changed from the default-value to provide a human-readable description of the node.
-
Title: Specifies the Title for the resulting graph that will appear in the Runbook Analysis.
-
Position in Runbook Output: Specifies the relative positioning of this visualization as it will appear in the Runbook Analysis.
-
Metrics: Specifies the target Metric whose data will be visualized in the Runbook Analysis.
WARNING: There is a bug. The selector-field states "Set default columns in the table" but this selector field is not a table. -
Style: Specifies the graph-style [Line, Area, Stacked Area, Step, Step (Area)] for the resulting graph that will appear in the Runbook Analysis.
-
Show Legend: A Checkbox that provides option to show/hide the Legend for the resulting graph that will appear in the Runbook Analysis.
-
Legend: Specifies location (Top, Bottom, Left, Right) of the Legend (if shown) relative to the resulting graph that will appear in the Runbook Analysis.
-
Notes: Provides ability to provide textual-content with the resulting graph that will appear in the Runbook Analysis.
-
Notes Position: Specifies location (Left, Right, Top, Bottom) of the Notes relative to the resulting graph that will appear in the Runbook Analysis.
-
Close / Save & Close (buttons): Used to close this Properties pane after viewing, or to save and close this Properties pane after editing.
Data Queries: Network Interfaces
Data Queries: Network Interfaces has the following set of properties that control what data/context is queried, and in what format it is represented. Access this set properties in the Runbook Editor by selecting the node on the canvas and clicking the pencil icon above it. The Properties open in a pane at the right.
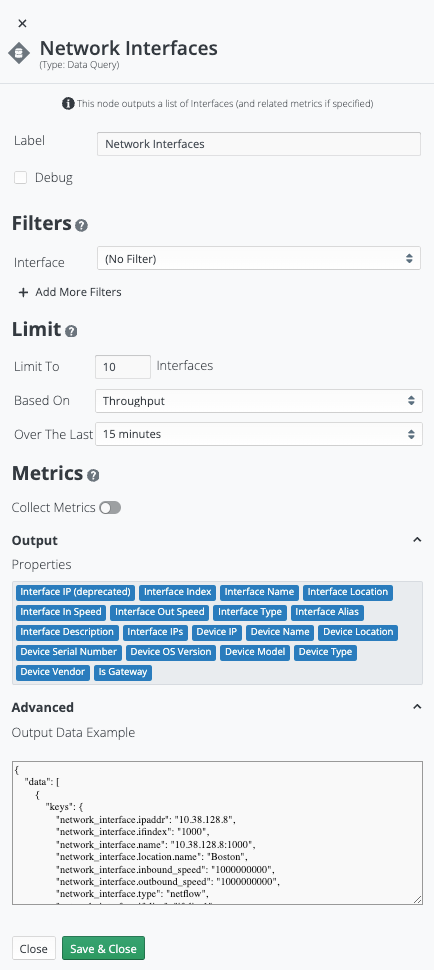
Data Queries: Network Interfaces properties descriptions:
-
Label: Can be changed from the default-value to provide a human-readable description of the node.
-
Debug: A checkbox that enables debug capabilities (e.g. logging of execution).
-
Filters / Interface: Pick-list that specifies how the Data Query should be filtered, e.g.:
-
Interface from trigger: The Data Query should gather data/context for the Interface provided by the Trigger (i.e. the Primary Indicator).
-
Interface from closest parent: The Data Query should gather data/context for the Interface provided by the closest/preceding Runbook node (e.g. an automated investigation may be exploring Interfaces beyond what triggered the Runbook execution).
-
-
Limit: Defines a limit on the Data Query (e.g. Top ten interfaces by Throughput over the last 15-minutes).
NOTE: This content disappears when Filters/Interface: Interface from Trigger is selected (i.e. this by definition limits the Data Query to a single Interface). -
Metrics
A measurement or data point that is monitored and analyzed to detect anomalies and generate incidents.: Specify the desired metrics A measurement or data point that is monitored and analyzed to detect anomalies and generate incidents. for the Data Query to gather.-
Collect Metrics: A toggle for enabling metrics collection.
-
Output Data Format: Select the desired format for the Data Query to output the data/context.
-
Summarized: Tabular summary.
-
Time series: Time series graph format.
-
-
<Type in the metrics to see the list and select>: Specifies the metric (or list of metrics) this Data Query must gather for the requested Interface.
-
Collect Data For Last: Specify the period for which the Data Query is to gather data/context.
-
Include Comparison Data From: A toggle for enabling Data Query to also collect comparison data for an offset time period (i.e. Previous Day, one Week Prior, four Weeks Prior).
-
-
Output (Chevron): Enumerates the list of possible Interface Properties for the Data Query to gather.
-
Advanced (Chevron): Provides a detailed description of the JSON used to pass data from this node to the next.
-
Close / Save & Close (buttons): Used to close this Properties pane after viewing, or to save and close this Properties pane after editing.
Visualization: Table
Visualization: Table has the following set of properties that control the logic applied to available data/context (in this case the data/context supplied by the Trigger) to determine the desired path of Runbook execution. Access this set properties in the Runbook Editor by selecting the node on the canvas and clicking the pencil icon above it. The Properties open in a pane at the right.
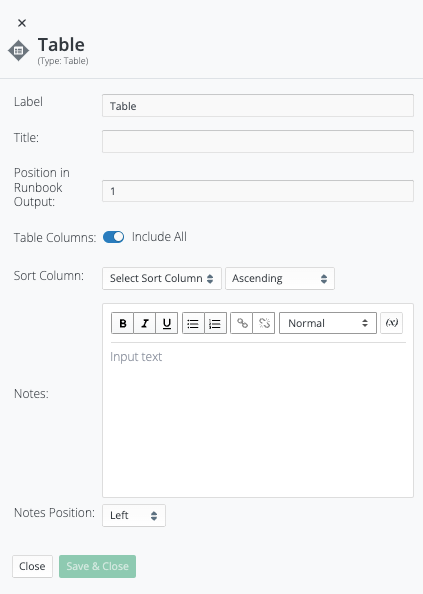
Visualization: Table properties descriptions:
-
Label: Can be changed from the default-value to provide a human-readable description of the node.
-
Title: Specifies the Title for the resulting graph that will appear in the Runbook Analysis.
-
Position in Runbook Output: Specifies the relative positioning of this visualization as it will appear in the Runbook Analysis.
-
Table Columns / Include All: A toggle that will include all supplied columns of data in the resulting table that will appear in the Runbook Analysis.
-
Sort Column: Controls for formatting the presentation of Table contents in the resulting table that will appear in the Runbook Analysis.
-
Notes: Provides ability to provide textual-content with the resulting graph that will appear in the Runbook Analysis.
-
Notes Position: Specifies location (Left, Right, Top, Bottom) of the Notes relative to the resulting graph that will appear in the Runbook Analysis.
-
Close / Save & Close (buttons): Used to close this Properties pane after viewing, or to save and close this Properties pane after editing.