Data Forensics Sidebar
Use the Data Forensics sidebar to choose which data dimension to load into the main table. The sidebar is the left-most pane in Data Forensics. It displays the available group bys![]() In Workspaces Data Forensics, a dimension (e.g. application, host, service, client IP) that you choose from the sidebar to load data into the main table. Data is aggregated or broken down by that dimension. The sidebar lists available group bys for the selected analysis workspace. for tracking data across Riverbed products. You drag or double-click a group by into the main table to populate it with data for that dimension (e.g. application, host, service).
In Workspaces Data Forensics, a dimension (e.g. application, host, service, client IP) that you choose from the sidebar to load data into the main table. Data is aggregated or broken down by that dimension. The sidebar lists available group bys for the selected analysis workspace. for tracking data across Riverbed products. You drag or double-click a group by into the main table to populate it with data for that dimension (e.g. application, host, service).
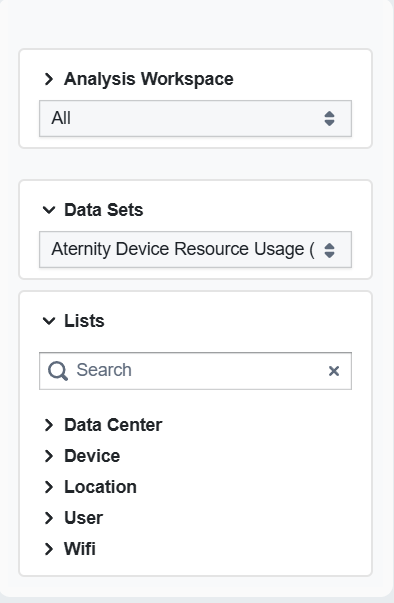
Analysis workspace
The sidebar can list one or more analysis workspaces. Each workspace groups data sets and group bys by use case. Examples include:
-
Endpoint Network Troubleshooting.
-
Digital Employee Experience.
-
Cloud Observability.
-
Application Performance.
Data sets
Data sets are additional filters that let you restrict which data the main table and panels use. Select a data set to narrow the scope of the analysis (e.g. to a specific data source or aggregation).
Vantage points
Under Analysis Workspace > Application Performance, the sidebar can show Vantage Points. Vantage points let you choose which Riverbed AppResponse (or other vantage) to retrieve data from. If no vantage point is selected, data is retrieved from all applicable sources.
Lists and search
The lists section shows the available group bys for the selected analysis workspace and data set. Use the search box to find a specific group by. Below the search, the sidebar displays groupings that contain entities![]() Things deployed in the customer environment that are needed to run the business, such as applications, devices, interfaces, and locations. you can drag into the main table to monitor specific data, such as Application or Client IP.
Things deployed in the customer environment that are needed to run the business, such as applications, devices, interfaces, and locations. you can drag into the main table to monitor specific data, such as Application or Client IP.