Data Store Widget
The Data Store widget displays data from the Data Ocean in tables and charts. You choose what to query (data source, group by![]() In Workspaces Data Forensics, a dimension (e.g. application, host, service, client IP) that you choose from the sidebar to load data into the main table. Data is aggregated or broken down by that dimension. The sidebar lists available group bys for the selected analysis workspace., filters, and metrics
In Workspaces Data Forensics, a dimension (e.g. application, host, service, client IP) that you choose from the sidebar to load data into the main table. Data is aggregated or broken down by that dimension. The sidebar lists available group bys for the selected analysis workspace., filters, and metrics![]() A measurement or data point that is monitored and analyzed to detect anomalies and generate incidents.), how to show it (table, bar chart, pie chart, time series, bubble chart, or other supported types), and how the widget interacts with other widgets on the workspace.
A measurement or data point that is monitored and analyzed to detect anomalies and generate incidents.), how to show it (table, bar chart, pie chart, time series, bubble chart, or other supported types), and how the widget interacts with other widgets on the workspace.
When to use the Data Store widget
Use the Data Store widget when you need to explore or visualize data from your connected data sources![]() A product in your network that forwards data to the system. This data can be streaming data used to detect anomalies and generate incidents, or data that can be fetched on demand when runbooks are executed. (for example, NPM+ traffic, application
A product in your network that forwards data to the system. This data can be streaming data used to detect anomalies and generate incidents, or data that can be fetched on demand when runbooks are executed. (for example, NPM+ traffic, application![]() An entity type representing software applications deployed in the customer environment that are monitored for performance and anomalies. performance, or Aternity data). It is the main widget for building custom data views and for linking those views through workspace interactions (for example, selecting a row in one table to filter a chart in another).
An entity type representing software applications deployed in the customer environment that are monitored for performance and anomalies. performance, or Aternity data). It is the main widget for building custom data views and for linking those views through workspace interactions (for example, selecting a row in one table to filter a chart in another).
Configuration
Configuration is done in a three-step dialog: Query (what data), Visualization (how it looks), and Interactions (how it responds to other widgets). For full steps, see Configuring a Widget. For which visualization types are available and how to configure each, see Data Store Visualization Types. For bar and time series charts, you can also set color options for Data Store widgets so each metric uses a chosen color.
When you place several Data Store widgets that use the Time chart visualization on one workspace, a vertical cursor line stays aligned across those charts at the same timestamp as you move the pointer, which helps correlate multiple time series at a glance. For details, see Synchronized vertical cursor on multiple time charts in Data Store Visualization Types.
Exporting visualization data
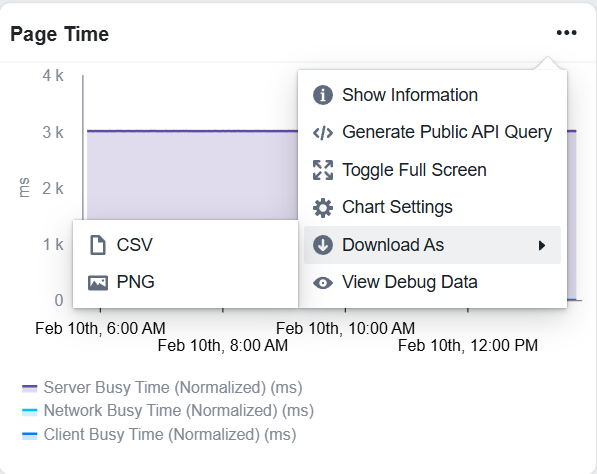
Data Store widgets support exporting chart and table data so you can use it in reports or other tools.
-
Charts (bar, time series, pie, bubble, correlation, and sparkline): Open the widget header menu (ellipsis), choose Download As, then CSV or PNG. CSV downloads the chart data, or PNG downloads an image of the chart.
-
Tables: Open the widget header menu and choose Download As CSV. The file includes all displayed data with units in column headers and raw numeric values.
Gauge and Summary visualizations use the export options in the chart or widget context menu when available.