Multi-Device Down Issue Incident Automation
Riverbed IQ Ops surfaces Multi-Device Down Issue Incidents when anomalies are detected in Key Measurements streaming from three (3) or more Entity type: Device (e.g. Device Status).
Workflow and Processing Logic of the Multi-Device Down Issue
This section will review the parallel execution-paths present in the Automation Name: “Multi-Device Down Analysis” Runbook and provide a high-level explanation of: Initialization, the parallel paths of execution (red-tags on left), and the various logic branches (dark-tabs on right)
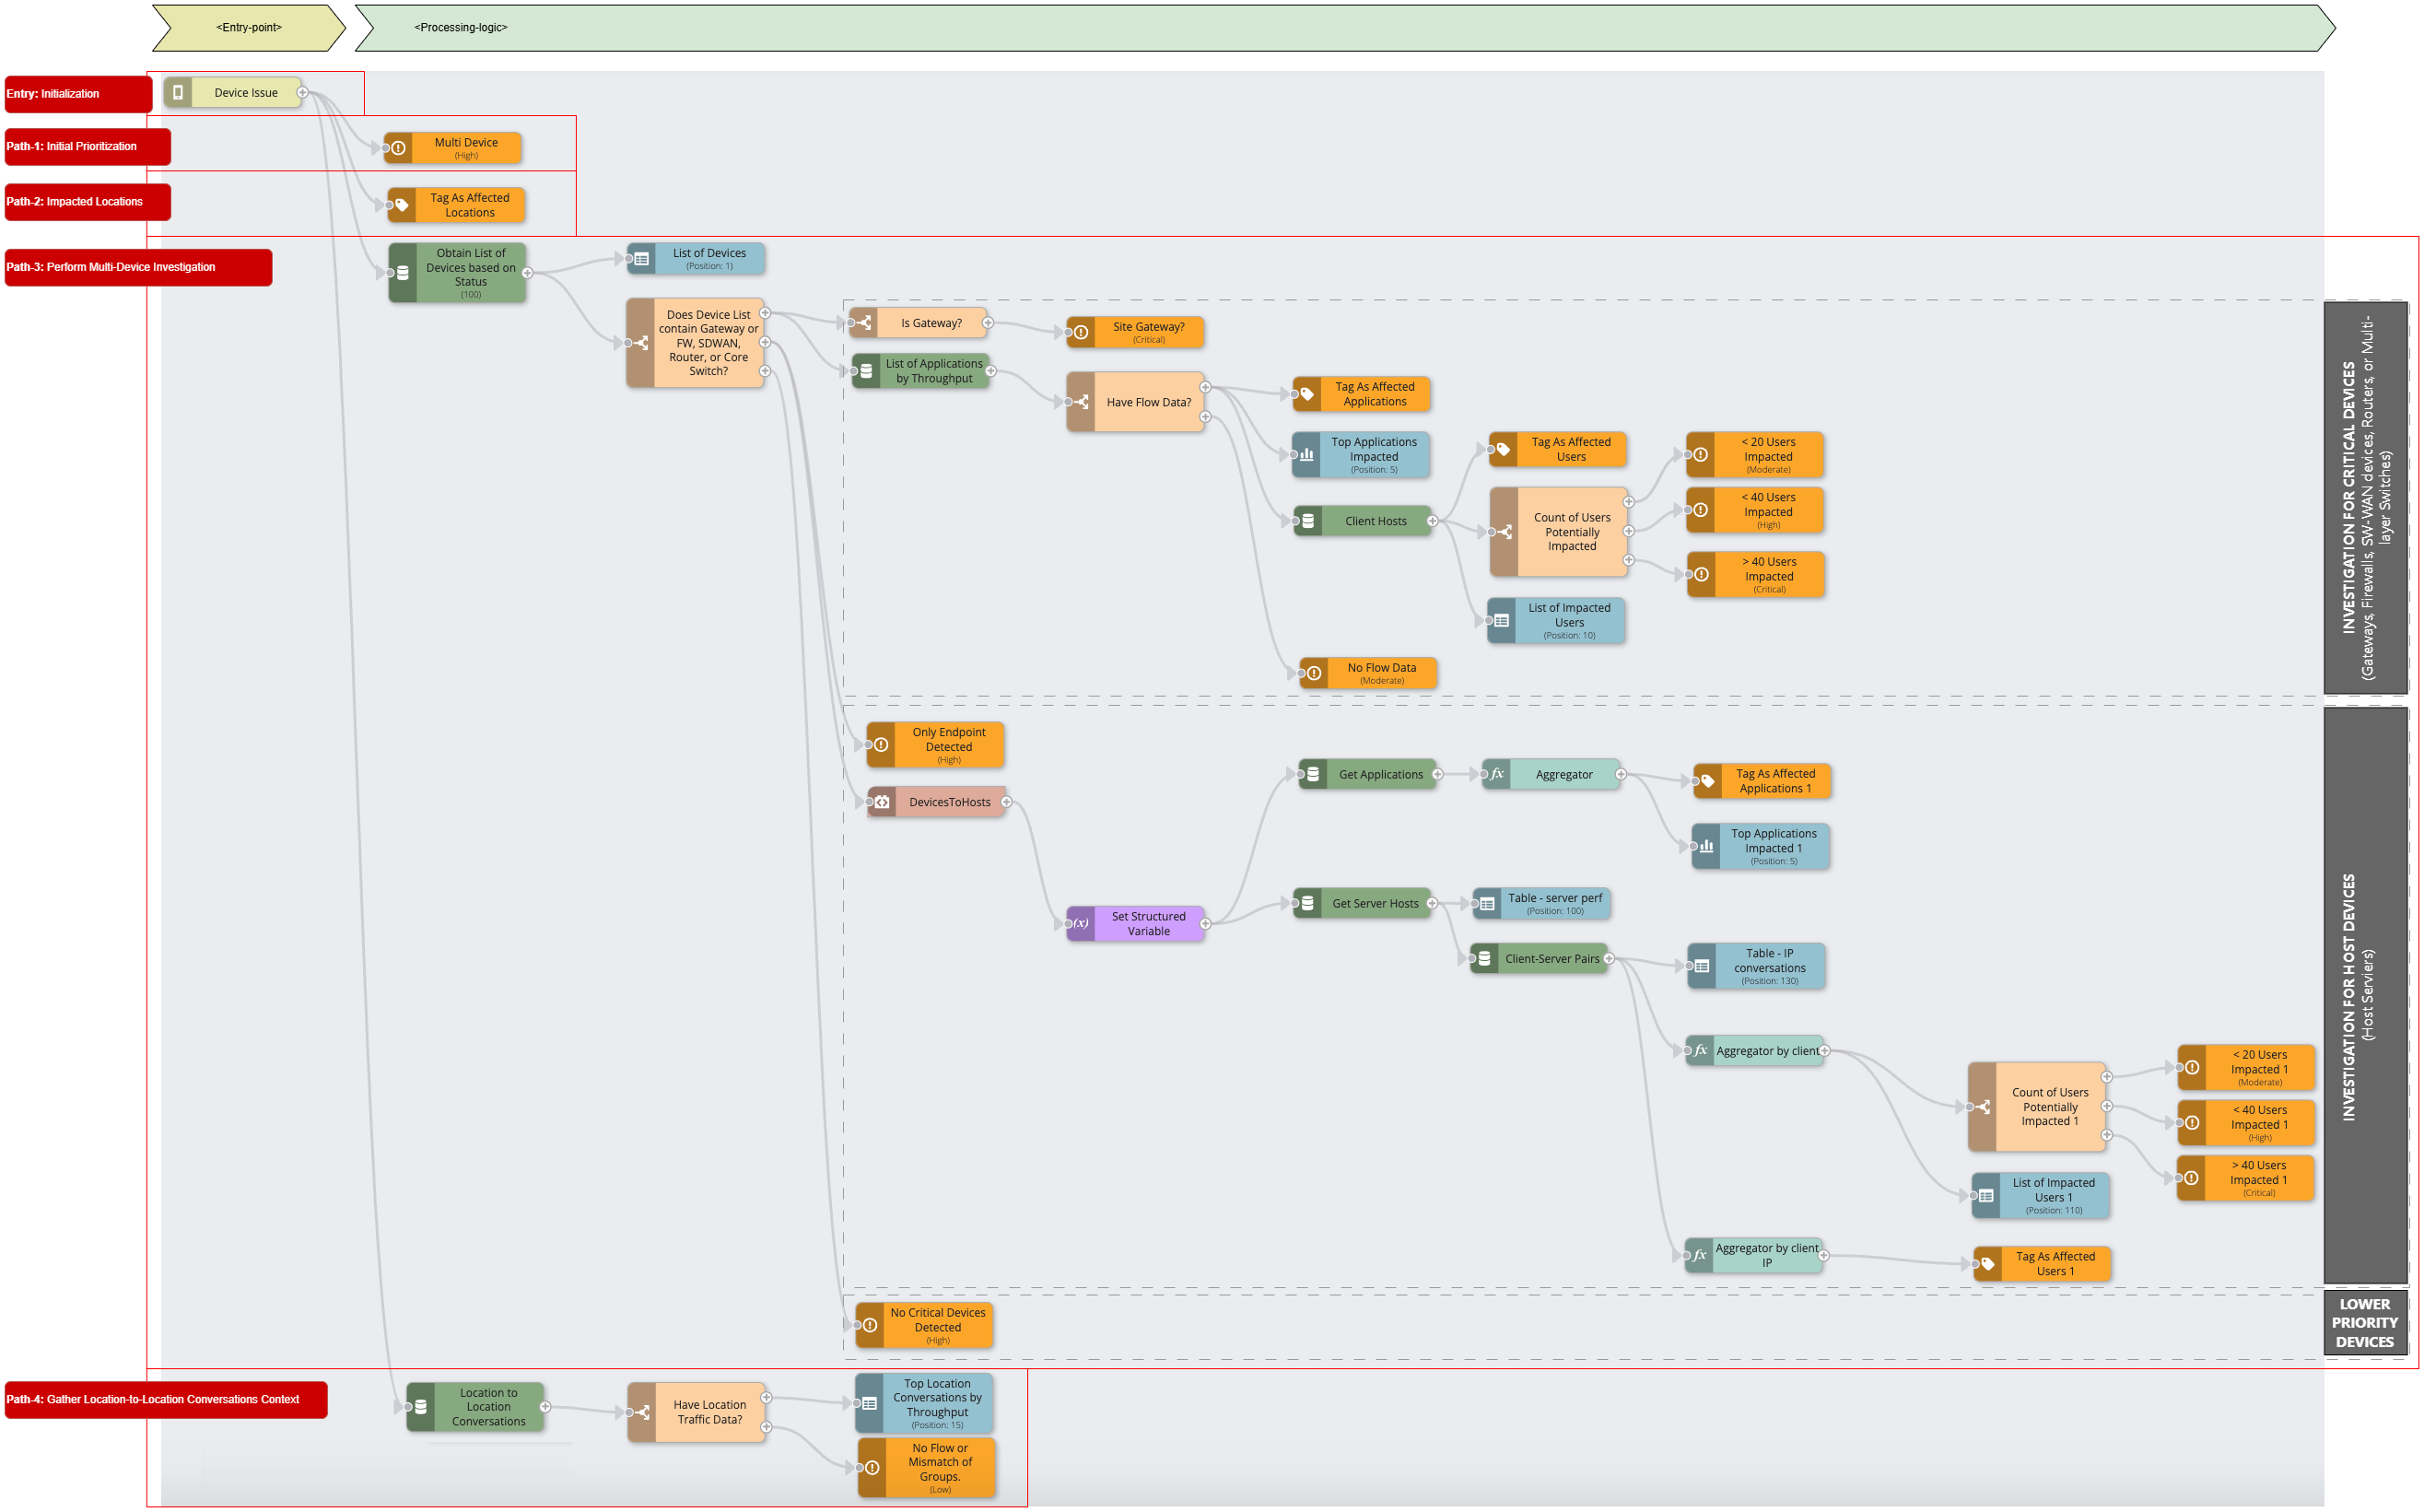
Automation Name: “Multi-Device Down Analysis” - Annotated
Entry: Initialization All Runbooks require a Triggering Entity as an “entry-point”. This entry-point provides a mechanism for Riverbed IQ Ops to pass all data/context gathered by the Analytics Pipeline (which generated the Incident) into the Runbook Automation. Multi-Device Down Issues are only triggered when there are three (3) or more affected Devices. For Triggering Entity: Devices (Labeled: “Device Issue”), the gathered Analytics Pipeline data/context will include Primary- and Correlated-Indicators that could include the following Key Measurements:
-
Device Status
-
Interface Status
-
In Packet Error Rate
-
Out Packet Error Rate
-
In Packet Drops Rate
-
Out Packet Drops Rate
-
In Utilization
-
Out Utilization
This “Entry-point” kicks-off four (4) parallel paths of execution.
Path-1: Initial Prioritization Immediately sets the initial Incident Priority for Multi-Device Down Issue to “High” (this may change over the course of Runbook execution).
Path-2: Impacted Locations Immediately tags the Locations of the source Entities as impacted.
Path-3: Perform Multi-Device Investigation Captures/visualizes the list of affected Devices and determines if this Incident affects critical Devices (e.g. Gateways, Firewalls, SW-WAN devices, Routers, or Multi-layer Switches), Host Servers, or lower priority Devices and then drills deeper to gather additional data/context (e.g. Devices, Applications, Users, …) needed to better assess prioritization and impacts:
-
For critical Devices: (e.g. Is Gateway or Device Type: {Gateways, Firewalls, SW-WAN devices, Routers, or Multi-layer Switches})
-
If the affected Device marked as Is Gateway, then escalate to Priority: Critical.
-
Gathers available Application Flow Data:
If there is no available Flow Data, then the Priority is set Priority: Moderate.-
Captures associated Application information:
-
Tags them as Affected Applications
-
Visualizes them as a Bar Chart.
-
-
Searches for associated Client Hosts to assess potentially impacted Users:
-
Tags them as Affected Users.
-
Visualizes them as a Table.
-
Sets Incident Priority according to the level of potentially impacted Users, i.e.
-
“Less than 20 users were impacted by this event.” > Set Priority To: Moderate.
-
“Less than 40 users were impacted by this event.” > Set Priority To: High.
-
“More than 40 users were impacted by this event.” > Set Priority To: Critical.
-
-
-
-
-
For Host Servers:
-
Since affected Device Type: Host, set Priority: High.
-
Gathers any available Host-related Data:
-
Converts Devices into associated Hosts:
-
This step leverages the Subflow DevicesToHosts which maps from Devices to Hosts and passes the result back using runtime variable.
-
-
Gathers Host-related Application data:
-
Tags associated Application data as impacted.
-
Visualizes associated Application data as Bar Chart.
-
-
Gathers Host-related User data:
-
Visualizes Server Hosts as a Table.
-
Finds “Client-Server Pairs” to derive User data:
-
Visualizes the associated IP Conversations as a Table.
-
Aggregates User data by Client:
-
Sets Incident Priority according to the level of potentially impacted Users, i.e.
-
“Less than 20 users were impacted by this event.” > Set Priority To: Moderate.
-
“Less than 40 users were impacted by this event.” > Set Priority To: High.
-
“More than 40 users were impacted by this event.” > Set Priority To: Critical.
-
-
Visualizes associated Client data as Table of impacted Users.
-
-
Aggregates User data by Client IP:
-
Tags associated Client IP data as impacted Users.
-
-
-
-
-
-
For lower priority Devices: Sets Incident Priority for Multi-Device Down Issue to High.
Path-4: Gather Location-to-Location Conversations Context captures/visualizes additional data/context related to the Incident:
-
Gathers any available “Location-to-Location Conversations”:
-
If any are found, visualize Conversations as a Table.
-
If none are found, set Incident Priority for Multi-Device Down Issue to Low.
-
Location of the Multi-Device Down Issue in Riverbed IQ Ops
You can find the associated Device Down Issue Incident Runbook automation in the Riverbed IQ Ops UI. From main-menu:
-
Mouse-over Automation, then select Automation Management to open the Automation Management page.
-
The Automation Management page contains summary-view of all supported Automations and their associated Runbooks.
-
-
In the Automation Management page, in the “New Incident Triggers” area, click on the Device Down Issue panel to open a detail-view for this type of Automation.
-
Each row in this detail-view represents an Automation that can execute to investigate this type of Incident.
-
-
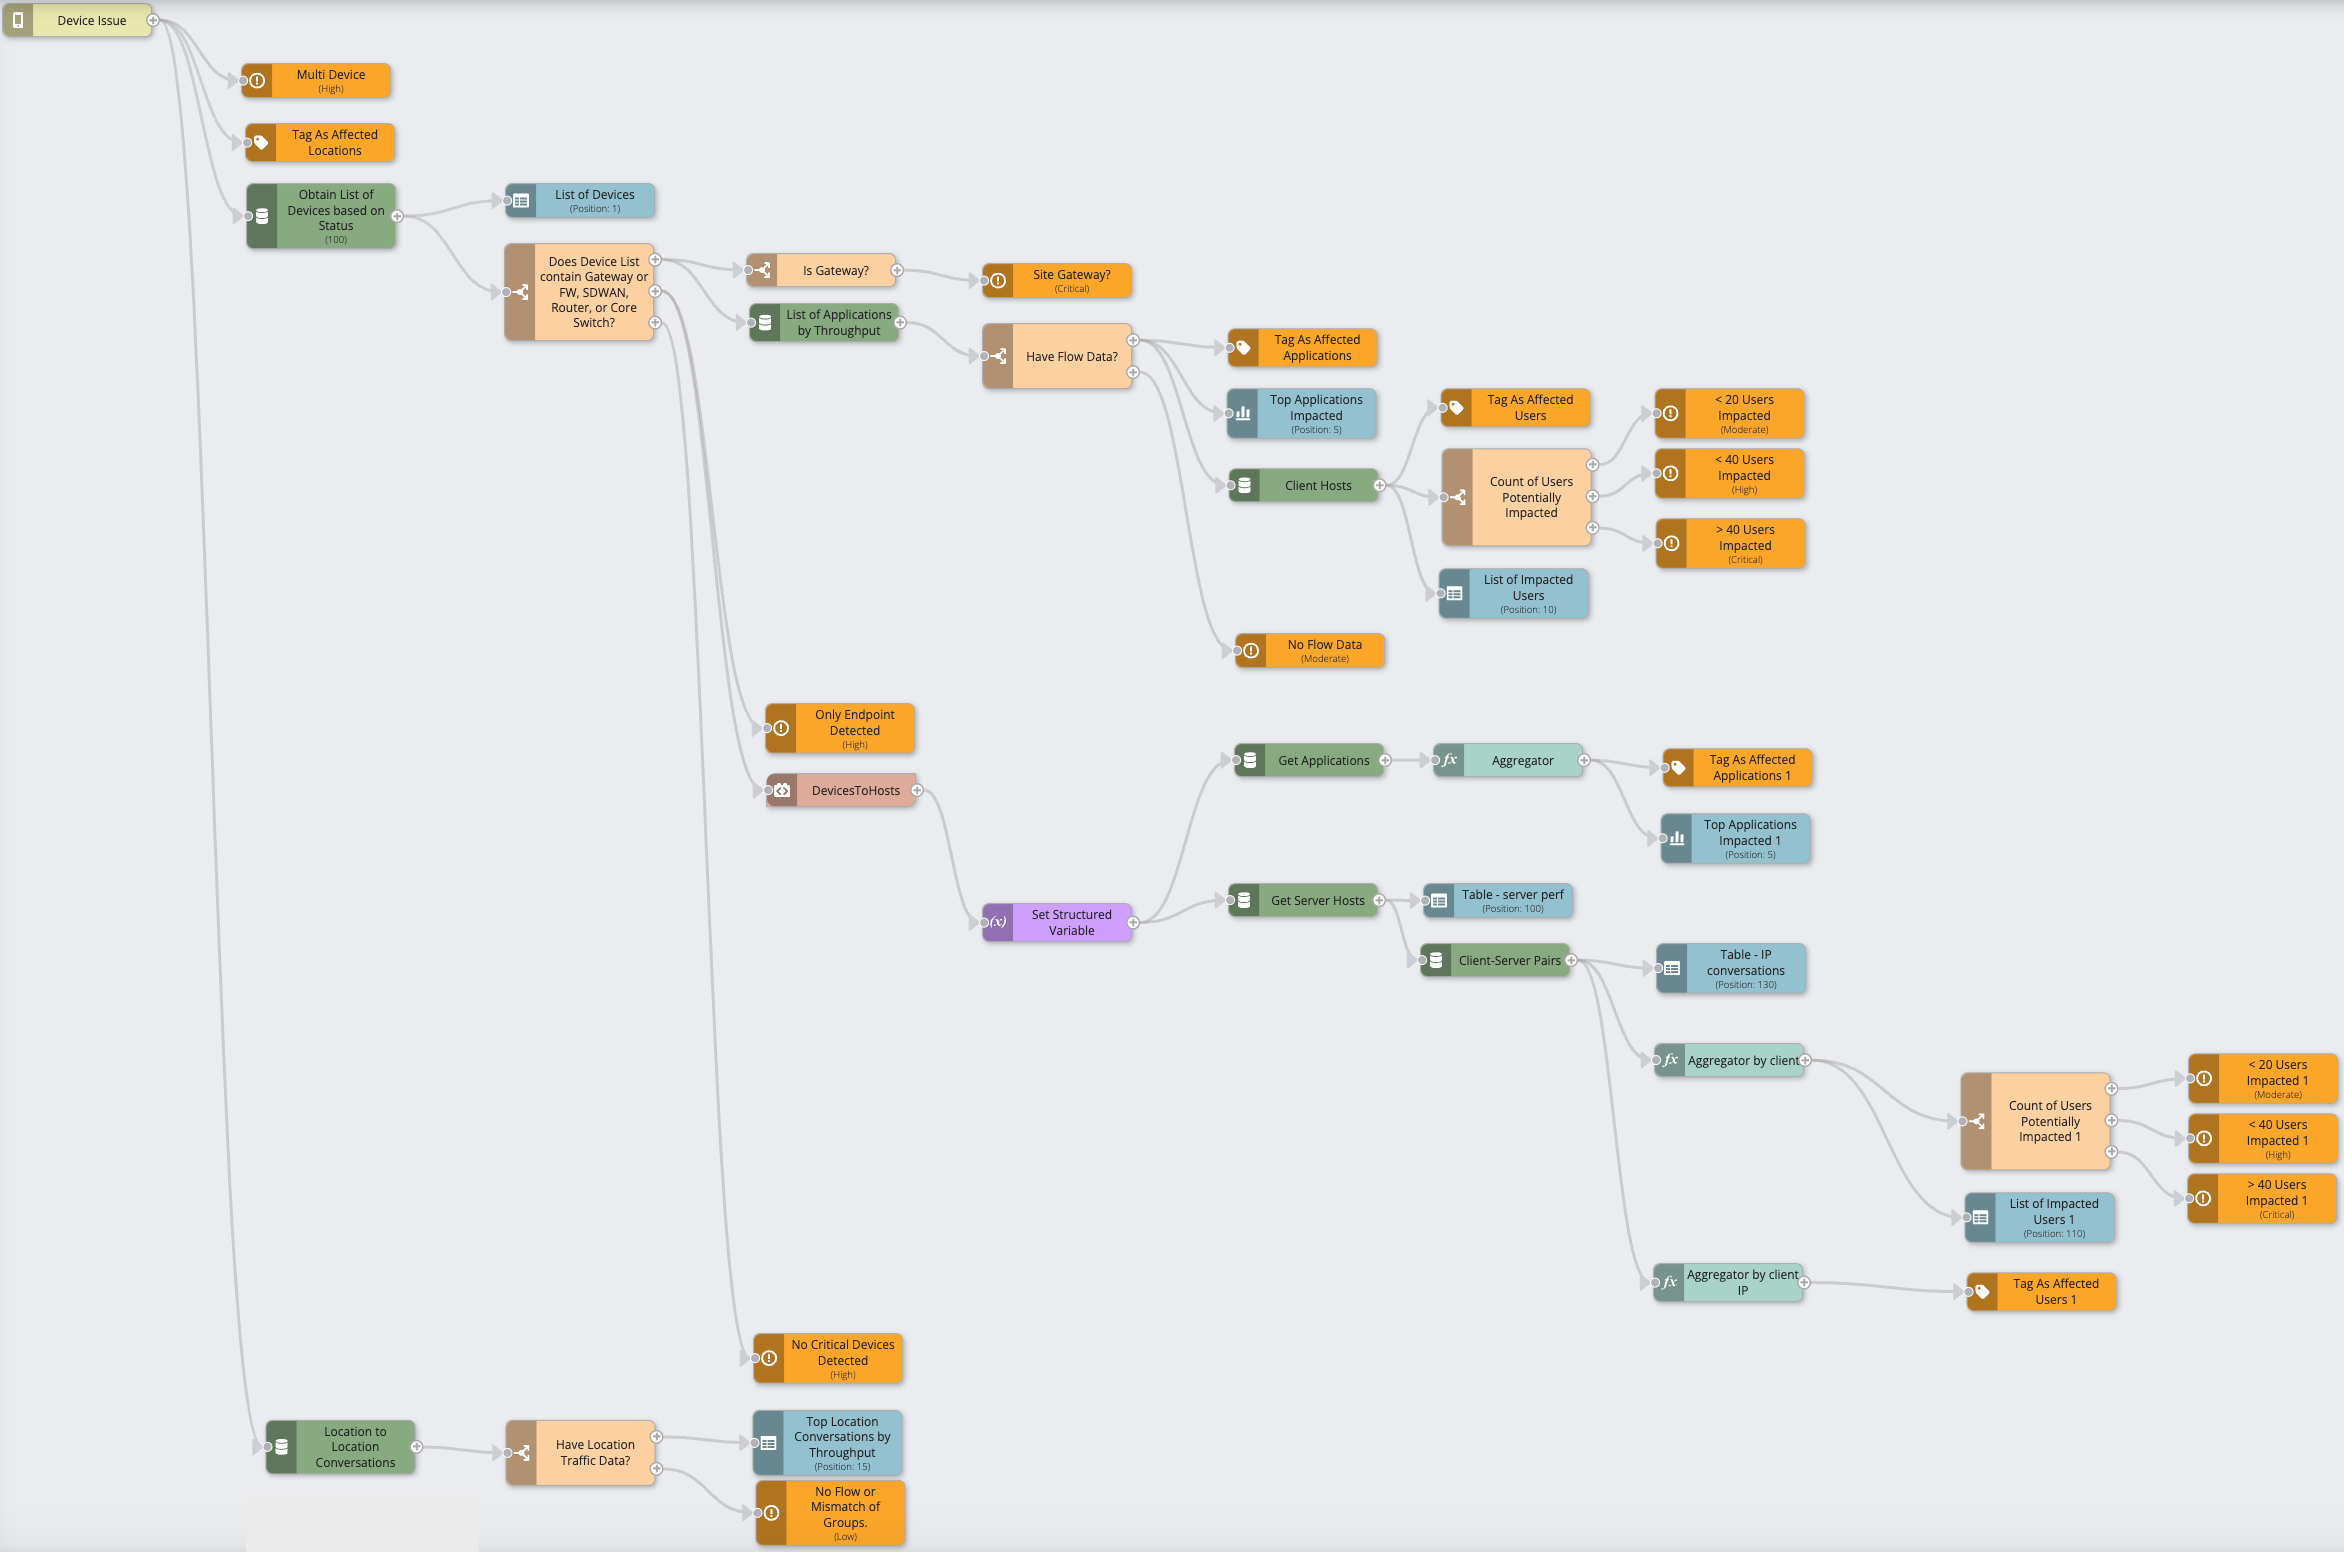
Find the row where Automation Name: “Device Analysis”, and click on the cell where Runbook: “Device Analysis” to open this “out-of-the-box” automation in the Runbook Editor and see its constituent nodes and structure, i.e.: (refer to diagram below)
Constituent Nodes and Structure
This section explains the constituent nodes and structure of the Multi-Device Down Issue Incident Automation. The following diagram contains the automation's entire constituent nodes and structure.
-
The required single entry-point.
-
The left-most light-green node
 Individual components that make up a runbook automation, each performing a specific function such as data queries, transformations, logic, integrations, or visualizations.: Triggering A set of one or more indicators that have been correlated based on certain relationships, such as time, metric type, application affected, location, or network device. Entity Things deployed in the customer environment that are needed to run the business, such as applications, devices, interfaces, and locations.: Devices An entity type representing network devices or hardware components deployed in the customer environment that are monitored for performance and anomalies.. This entry-point passes supporting data/context (gathered in the Analytics Pipeline, e.g. Primary Indicator An observed change in a specific metric stream that is recognized as being outside of an expected model. Indicators are correlated into triggers, and one or more triggers are grouped into incidents.) into the Runbook An automated workflow that executes a series of steps or tasks in response to a triggered event, such as the detection of anomalous behavior generating an incident, a lifecycle event, or a manually executed runbook.
-
-
A set of interconnected nodes which stem from the entry-point.
-
Each Node performs a specific function:
- Orange nodes: Set Priority A classification that indicates the importance or urgency of an incident, used to prioritize investigation and remediation efforts. and tag Impacts Uniform Resource Locator. The address used to access resources on the internet, such as webhook endpoints or API endpoints for runbook automation..
-
Green nodes: Initiate queries to Data Sources
A product in your network that forwards data to the system. This data can be streaming data used to detect anomalies and generate incidents, or data that can be fetched on demand when runbooks are executed. and gather additional data/context to further the investigation. -
Beige nodes: Decision Branches perform logic
A runbook node category that adds conditions to branch the runbook, enabling conditional execution paths based on data and context.-tests to determine the path of execution. -
Blue nodes: Visualize
A runbook node category that shows data in a chart, graph, table, or note, providing visual representation of analysis results in runbook output. findings in an appropriate format. -
Pink nodes: Subflows
A reusable automation chunk that performs frequently used functions, such as opening a ticket in an external system, and can be used to implement integrations with third-party systems. that provide containerized reusable Runbook-segements. -
Purple nodes: Variables that can set information for easy access.
- Orange nodes: Set Priority
-
These nodes are structured into multiple parallel paths of execution in order to gather all relevant data/context needed to investigate Multi-Device Down Issues. These paths set Priority, assess Impacts, and Visualize findings.
-