Device Down Issue Incident Automation
Riverbed IQ Ops surfaces Device![]() An entity type representing network devices or hardware components deployed in the customer environment that are monitored for performance and anomalies. Down Issue Incidents
An entity type representing network devices or hardware components deployed in the customer environment that are monitored for performance and anomalies. Down Issue Incidents![]() A collection of one or more related triggers. Relationships that cause triggers to be combined into incidents include application, location, operating system, or a trigger by itself. when it detects anomalies
A collection of one or more related triggers. Relationships that cause triggers to be combined into incidents include application, location, operating system, or a trigger by itself. when it detects anomalies![]() An unexpected event or measurement that does not match the expected model. in Key Measurements
An unexpected event or measurement that does not match the expected model. in Key Measurements![]() A measurement or data point that is monitored and analyzed to detect anomalies and generate incidents. streaming from Entity type: Device (e.g. Device Status and Device Uptime). This topic explains the workflow and processing logic
A measurement or data point that is monitored and analyzed to detect anomalies and generate incidents. streaming from Entity type: Device (e.g. Device Status and Device Uptime). This topic explains the workflow and processing logic![]() A runbook node category that adds conditions to branch the runbook, enabling conditional execution paths based on data and context. of the Device Down Issue and directs you how to navigate to the issue in Riverbed IQ Ops.
A runbook node category that adds conditions to branch the runbook, enabling conditional execution paths based on data and context. of the Device Down Issue and directs you how to navigate to the issue in Riverbed IQ Ops.
Workflow and Processing Logic of the Device Down Issue
This section reviews the parallel execution-paths present in the Automation Name: “Device Down Issue (Default)” Runbook and provides a high-level explanation.
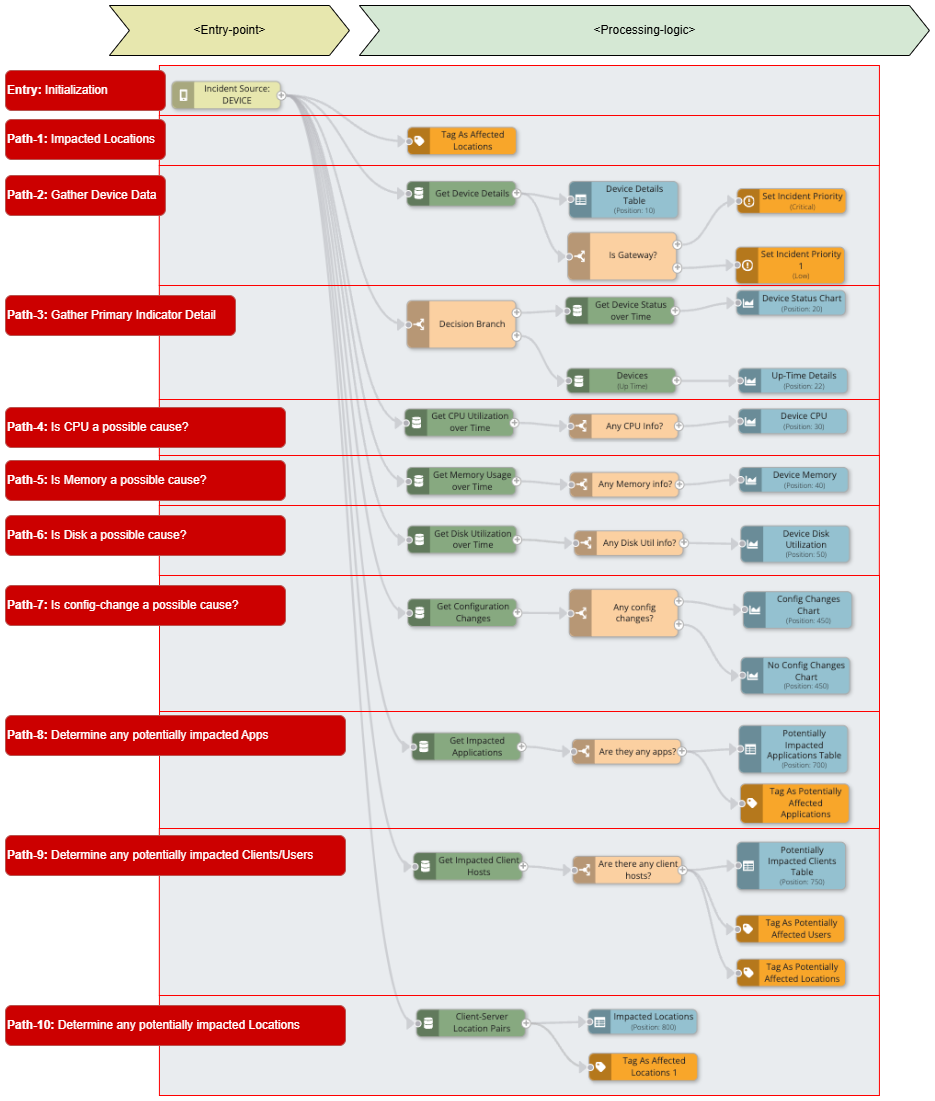
Automation Name: “Device Analysis” - Annotated
Entry: Initialization All Runbooks require a Triggering Entity as an “entry-point”. This entry-point provides a mechanism for Riverbed IQ Ops to pass all data/context gathered by the Analytics Pipeline (which generated the Incident) into the Runbook Automation. For Triggering Entity: Devices, the gathered Analytics Pipeline data/context includes Primary- and Correlated-Indicators for the following Key Measurements:
-
Device Status
-
Device Uptime
Path-1: Impacted Locations Immediately tags the Location of the source Entity as impacted.
Path-2: Gather Device Data Gathers additional Device detail for the Source Entity, and:
-
Visualizes the Device detail as a table in the Runbook Analysis.
-
Checks the Device detail to see if the Source Entity “Is Gateway” (i.e. critical resource), and sets either:
-
Priority: Critical if the Source Entry "Is Gateway".
-
Priority: Low.
-
Path-3: Gather Primary Indicator Detail Decides the path of execution based on the Primary Indicator (i.e. the Key Measurement metric that triggered this event) to gather additional relevant data/context:
-
If the triggering metric is Device Status, then:
-
The Runbook gathers Device Status information for the period prior to the event (and comparison data from prior week).
-
The Runbook visualizes the gathered Device Status information as a Timeseries chart.
-
-
If the triggering metric is Device Uptime, then:
-
The Runbook gathers Device Uptime information for period just prior to the event (and comparison data from previous day).
-
Visualize the gathered Device Uptime information as a Timeseries chart.
-
Path-4: Is CPU a possible cause? Gathers additional data/context CPU Utilization. For example, a sudden CPU spike might indicate a problem leading to a device becoming unresponsive.
Path-5: Is Memory a possible cause? Gathers additional data/context Memory Usage.For example, high memory usage might indicate a memory leak or an overload issue leading to a device becoming unresponsive:
Path-6: Is Disk a possible cause? Gathers additional data/context Disk Utilization. For example, a sudden increase in disk activity might indicate a problem leading to a device becoming unresponsive:
Path-7: Is config-change a possible cause? Gathers additional data/context configuration Changes. For example, configuration changes on a device might cause a device to be temporarily unavailable:
Path-8: Determine any potentially impacted![]() Uniform Resource Locator. The address used to access resources on the internet, such as webhook endpoints or API endpoints for runbook automation. Apps Gathers additional top-100 Application
Uniform Resource Locator. The address used to access resources on the internet, such as webhook endpoints or API endpoints for runbook automation. Apps Gathers additional top-100 Application![]() An entity type representing software applications deployed in the customer environment that are monitored for performance and anomalies.-related data/context for the source Entity (based on Throughput) to assess potential impacts. If the data is available, it will:
An entity type representing software applications deployed in the customer environment that are monitored for performance and anomalies.-related data/context for the source Entity (based on Throughput) to assess potential impacts. If the data is available, it will:
-
Visualize
 A runbook node category that shows data in a chart, graph, table, or note, providing visual representation of analysis results in runbook output. the list of top-100 potentially impacted Applications as a Table
 -
Tag the top-100 Applications as potentially impacted.
Path-9: Determine any potentially impacted Clients/Users Gathers additional top-100 Client-related data/context for the source Entity (based on Throughput) to assess potential impacts. If the data is available, it will:
-
Visualize the list of top-100 potentially impacted Clients as a Table.
-
Tag the top-100 Clients as potentially impacted Users.
-
Tag the top-100 Client Locations
An entity type representing physical or logical locations in the customer environment where entities are deployed and monitored. as potentially impacted Locations.
Path-10: Determine any potentially impacted Locations Gathers additional top-10 Client-Server Location Pairs for the source Entity (based on Throughput) to assess potential impacts. If the data is available, it will:
-
Visualize the list of top-10 potentially impacted Locations as a Table.
-
Tag the top-10 Locations as potentially impacted Locations.
Location of the Device Down Issue in Riverbed IQ Ops
You can find the associated Device Down Issue Incident Runbook automation in the Riverbed IQ Ops UI. From main-menu:
-
Click Automation, then select Automation Management to open the Automation Management page.
-
The Automation Management page contains a summary-view of all supported Automations and their associated Runbooks.
-
-
In the "New Incident Triggers" area of the Automation Management page, click on the Device Down Issue panel to open a detail-view for this type of Automation.
-
Each row in this detail-view represents an Automation that can execute to investigate this type of Incident.
-
-
Find the row with Automation Name: “Device Down Issue (Default)”. Click on the cell with Runbook: “Device Analysis” to open this “out-of-the-box” automation in the Runbook Editor and see its constituent nodes and structure.
Constituent Nodes and Structure
This section explains the constituent nodes and structure of the Device Down Issue Incident Automation. The following diagram contains the automation's entire constituent nodes and structure.
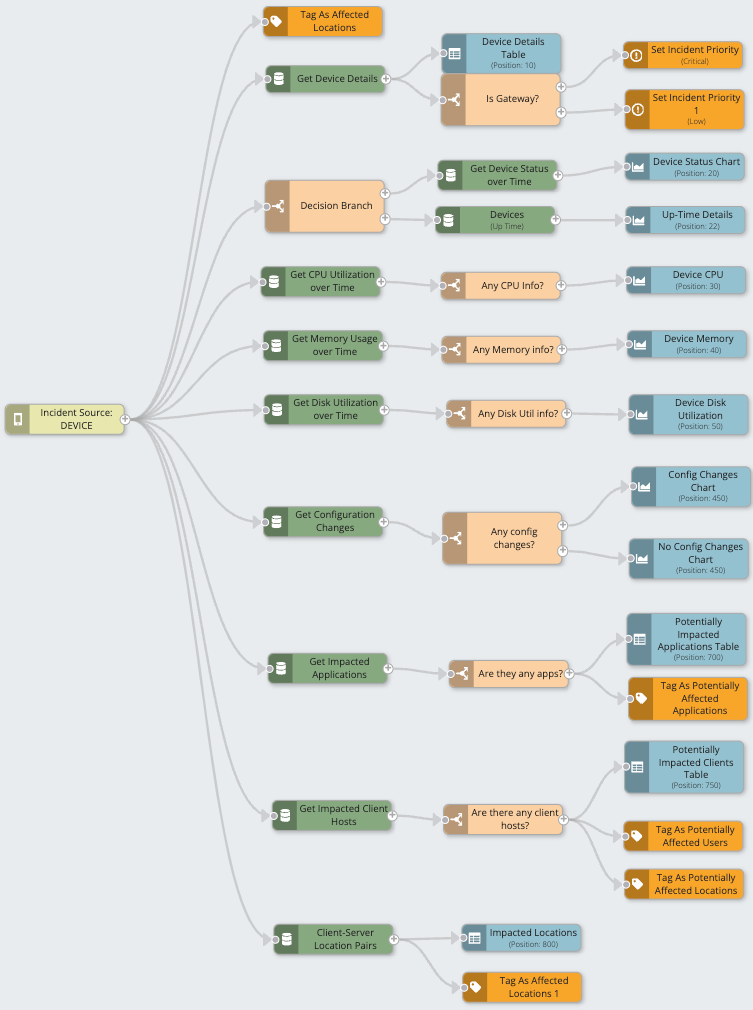
The automation contains:
-
The required single entry-point.
-
The left-most light-green node: Triggering Entity: Devices. This entry-point passes supporting data/context (gathered in the Analytics Pipeline, e.g. Primary Indicator) into the Runbook
-
-
A set of interconnected nodes which stem from the entry-point.
-
Each Node
Individual components that make up a runbook automation, each performing a specific function such as data queries, transformations, logic, integrations, or visualizations. performs a specific function:- Orange nodes: Set Priority A classification that indicates the importance or urgency of an incident, used to prioritize investigation and remediation efforts. and tag Impacts.
-
Green nodes: Initiate queries to Data Sources
A product in your network that forwards data to the system. This data can be streaming data used to detect anomalies and generate incidents, or data that can be fetched on demand when runbooks are executed. and gather additional data/context to further the investigation. -
Beige nodes: Decision Branches perform logic-tests to determine the path of execution.
-
Blue nodes: Visualize findings in an appropriate format.
- Orange nodes: Set Priority
-
The nodes are structured into multiple parallel paths of execution to gather all relevant data/context needed to investigate Device Down Issue. These paths set Priority, assess Impacts, and Visualize findings.
-