Riverbed Console Navigation
Riverbed Console is the main entry point for the Riverbed Technology platform. Everything you do in the platform starts from the Console UI![]() User Interface. The visual components and controls that users interact with to access features and manage the system.: viewing incidents
User Interface. The visual components and controls that users interact with to access features and manage the system.: viewing incidents![]() A collection of one or more related triggers. Relationships that cause triggers to be combined into incidents include application, location, operating system, or a trigger by itself., configuring analytics, managing automations
A collection of one or more related triggers. Relationships that cause triggers to be combined into incidents include application, location, operating system, or a trigger by itself., configuring analytics, managing automations![]() Automated procedures that are executed as the result of a trigger. Automations consist of a single entry point and a sequence of connected nodes that define the processing logic. and runbooks
Automated procedures that are executed as the result of a trigger. Automations consist of a single entry point and a sequence of connected nodes that define the processing logic. and runbooks![]() An automated workflow that executes a series of steps or tasks in response to a triggered event, such as the detection of anomalous behavior generating an incident, a lifecycle event, or a manually executed runbook., adding data sources
An automated workflow that executes a series of steps or tasks in response to a triggered event, such as the detection of anomalous behavior generating an incident, a lifecycle event, or a manually executed runbook., adding data sources![]() A product in your network that forwards data to the system. This data can be streaming data used to detect anomalies and generate incidents, or data that can be fetched on demand when runbooks are executed., and opening workspaces. This topic explains how to move around the Console so you can find the right area for your task. Use it when you are new to the platform or when you need a quick map of what each part of the menu does.
A product in your network that forwards data to the system. This data can be streaming data used to detect anomalies and generate incidents, or data that can be fetched on demand when runbooks are executed., and opening workspaces. This topic explains how to move around the Console so you can find the right area for your task. Use it when you are new to the platform or when you need a quick map of what each part of the menu does.
How you get around
In the top-left of every page, next to the Riverbed Technology logo, a ⁝⁝⁝ button opens the main menu (called the Launchpad). The Launchpad lists the main areas of the platform:
-
Home.
-
Digital Experience.
-
IQ Ops.
-
Network Observability.
-
Workspaces.
The exact items you see depend on your permissions and how your tenant is configured. Click a menu entry to open that area or to see sub-entries such as Analytics & Incidents, Automations, or Management.
Home
Home is the default page when you open the Console. You can also open it from the main menu. Home is a workspace you can customize: click Edit Workspace to add, remove, or arrange widgets.
By default it shows three widgets: Runbooks Summary (a quick view of your runbooks), Recently Viewed (pages you opened recently), and What's New (recent changes to the platform). Use Home as your daily starting point and tailor it to the information you care about most.
Digital Experience
This area focuses on end-user and endpoint experience. Use it when you need to discover and track application usage, score performance (crashes, hangs, errors, load times), or monitor mobile and endpoint devices. It can include End User Experience Monitoring, Data Forensics (troubleshooting across the data store), and Mobile Endpoint Experience Monitoring, depending on your configuration.
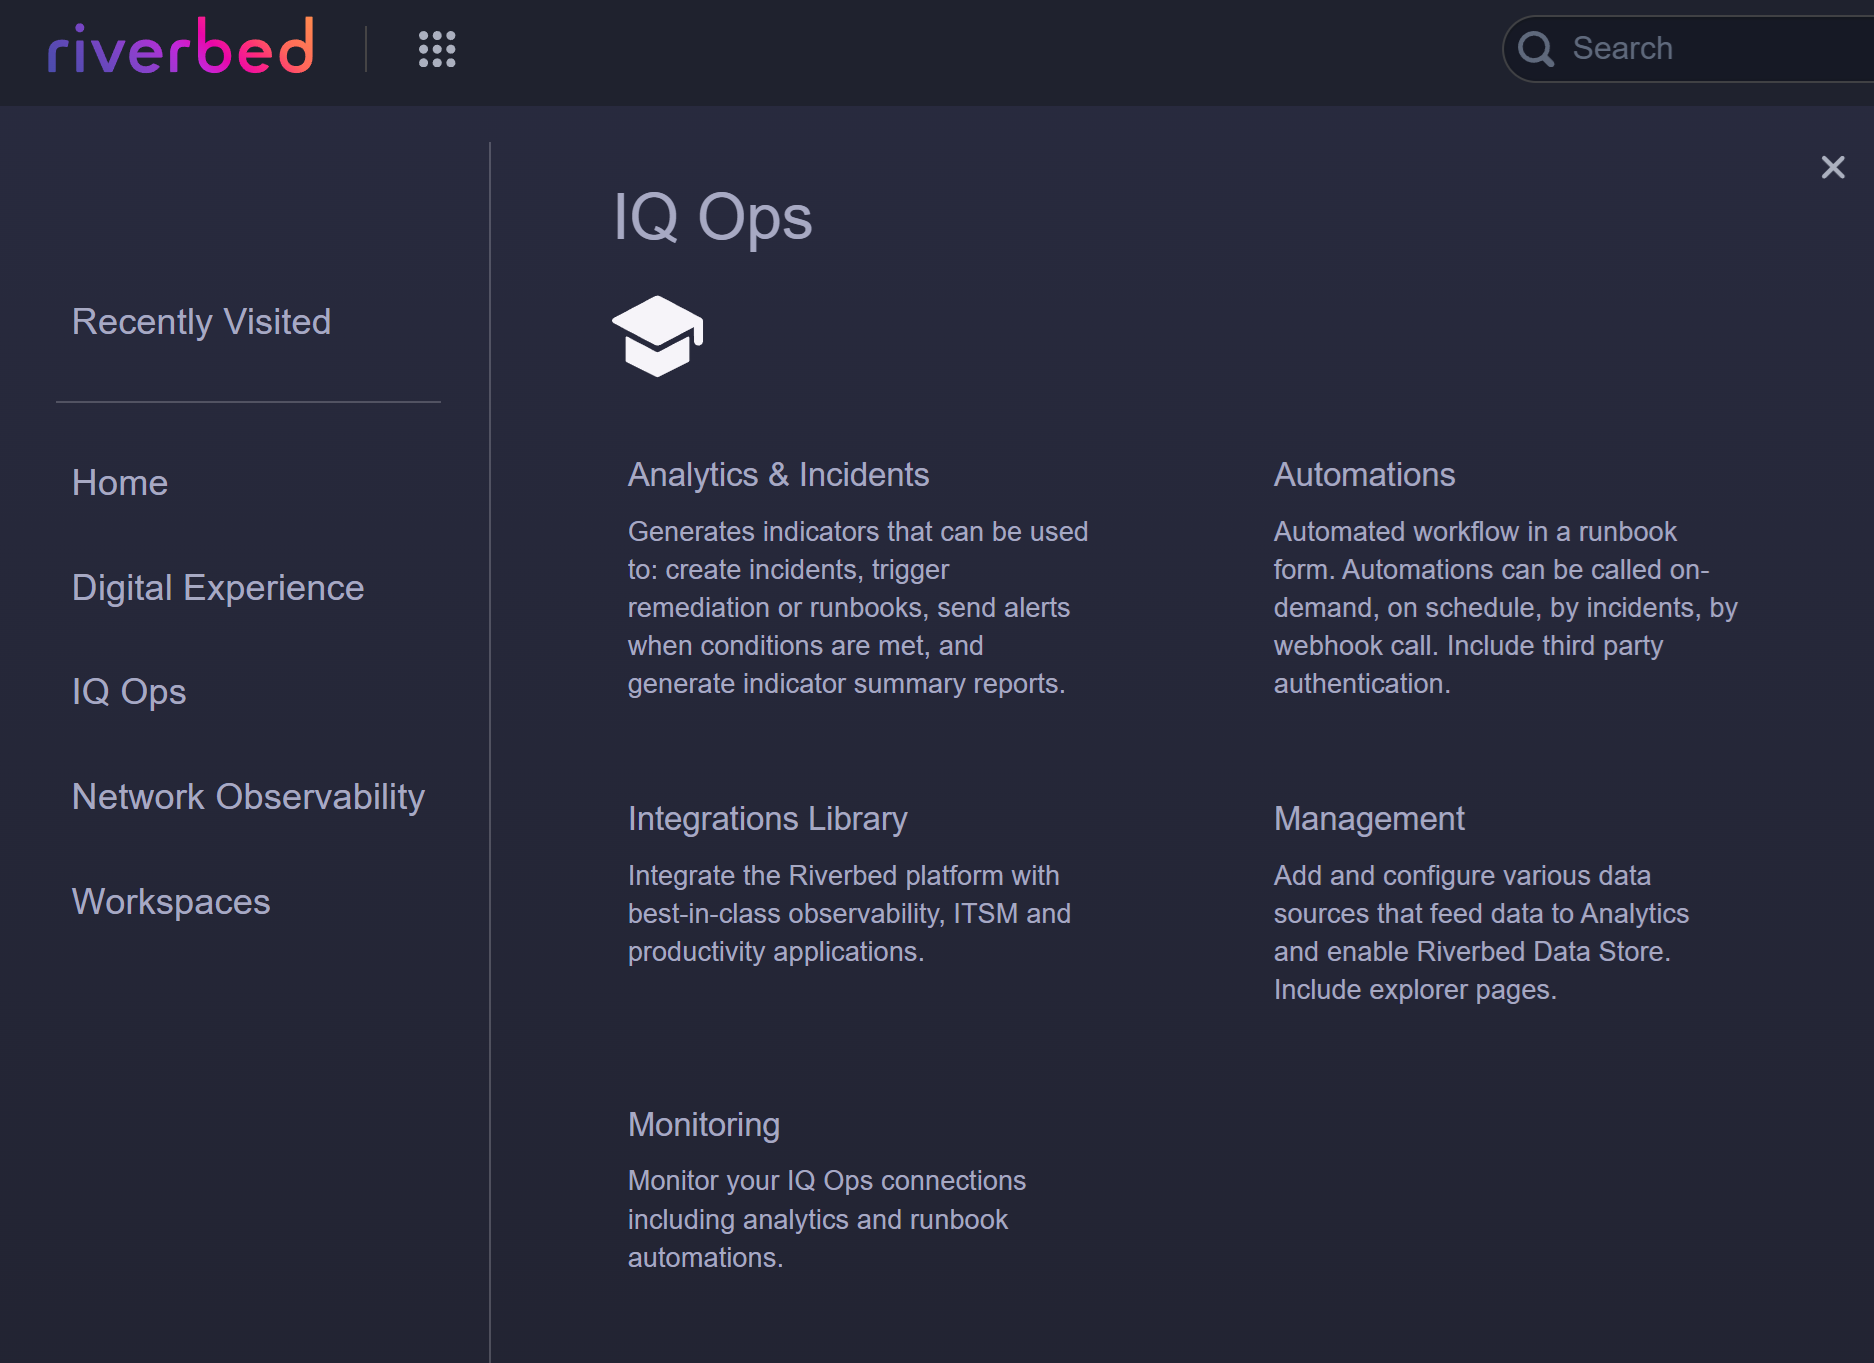
IQ Ops
This menu gives you access to Riverbed IQ Ops: analytics that observe your environment, detect![]() One or more indicators that are correlated and may act as a trigger for incident creation or runbook execution. anomalies
One or more indicators that are correlated and may act as a trigger for incident creation or runbook execution. anomalies![]() An unexpected event or measurement that does not match the expected model. with machine learning, correlate events to reduce noise, and surface incidents
An unexpected event or measurement that does not match the expected model. with machine learning, correlate events to reduce noise, and surface incidents![]() A collection of one or more related triggers. Relationships that cause triggers to be combined into incidents include application, location, operating system, or a trigger by itself. with context. Use it when you need to configure or view analytics and incidents, manage runbooks and automations, connect integrations, manage data sources and users, or monitor platform health and usage.
A collection of one or more related triggers. Relationships that cause triggers to be combined into incidents include application, location, operating system, or a trigger by itself. with context. Use it when you need to configure or view analytics and incidents, manage runbooks and automations, connect integrations, manage data sources and users, or monitor platform health and usage.
From the IQ Ops menu you can open:
-
Analytics & Incidents: Impact Dashboard, Incidents, and Analytics & Threshold configuration.
-
Automations: Automation Management, Runbook Analysis, Runbook Scheduling, Incident Runbooks, Lifecycle Runbooks, On-Demand Runbooks, External Runbooks, and Subflows.
-
Integrations Library: Connect the platform to observability, ITSM, and productivity applications.
-
Management: Edges & Data Sources, Third Party Authentication, API Access, Riverbed IQ Assist Configuration, User Management, and Explorer pages (Devices, Interfaces, Locations, Applications, User Devices, Custom Properties, TCP Connections).
-
Monitoring: Monitoring Health and Monitoring Usage (when enabled for your tenant).
Network Observability
This area covers network and cloud visibility. Use it when you need to monitor cloud assets across providers, manage the Unified Agent, use NPM+ for network performance visibility, or work with packet capture. Available entries can include Cloud Observability (Theater View, Cloud Assets, Rules, Data Source), Unified Agent, NPM+, and Packet Capture (Packet Capture Module and Packet Capture Configuration), depending on feature flags and permissions.
Workspaces
Workspaces are interactive analysis environments for troubleshooting and reporting. Use this menu when you want to open the Workspaces Library (to browse and open workspaces, including setting one as your home screen) or Data Forensics (Navigator) to build custom diagnostic workflows and inspect data. Workspaces let you go beyond fixed reports and tailor analysis to your needs.